| Start Page |
|
 |
| Start Page |
|
|
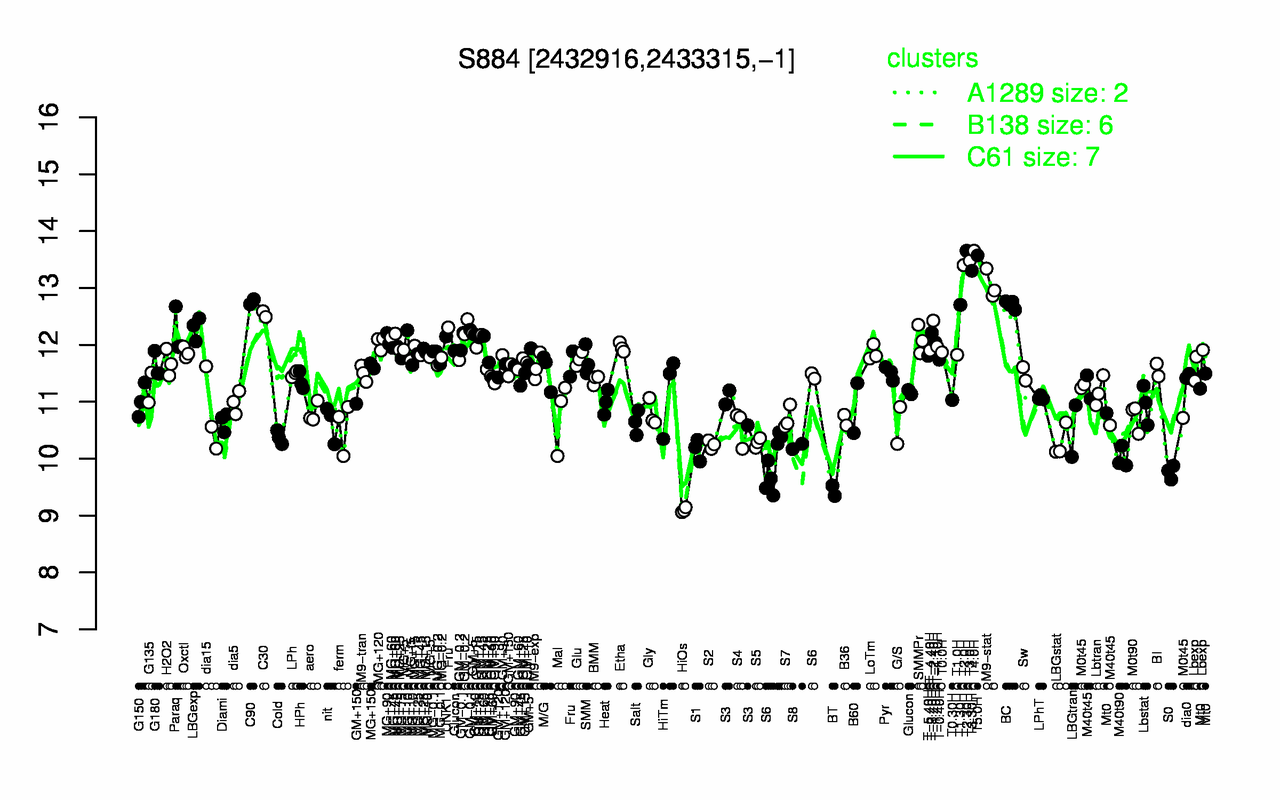
| T4.0H | T2.30H | T5.0H | T3.0H | T2.0H | T3.30H | M9-stat | C90 | BC | T1.30H |
| 13.7 | 13.7 | 13.6 | 13.5 | 13.4 | 13.3 | 13.1 | 12.8 | 12.7 | 12.7 |
| HiOs | BT | S0 | M40t90 | S1 | S8 | S2 | S6 | S5 | LBGstat |
| 9.1 | 9.44 | 9.77 | 10 | 10.2 | 10.2 | 10.2 | 10.3 | 10.3 | 10.3 |