| Start Page |
|
 |
| Start Page |
|
|
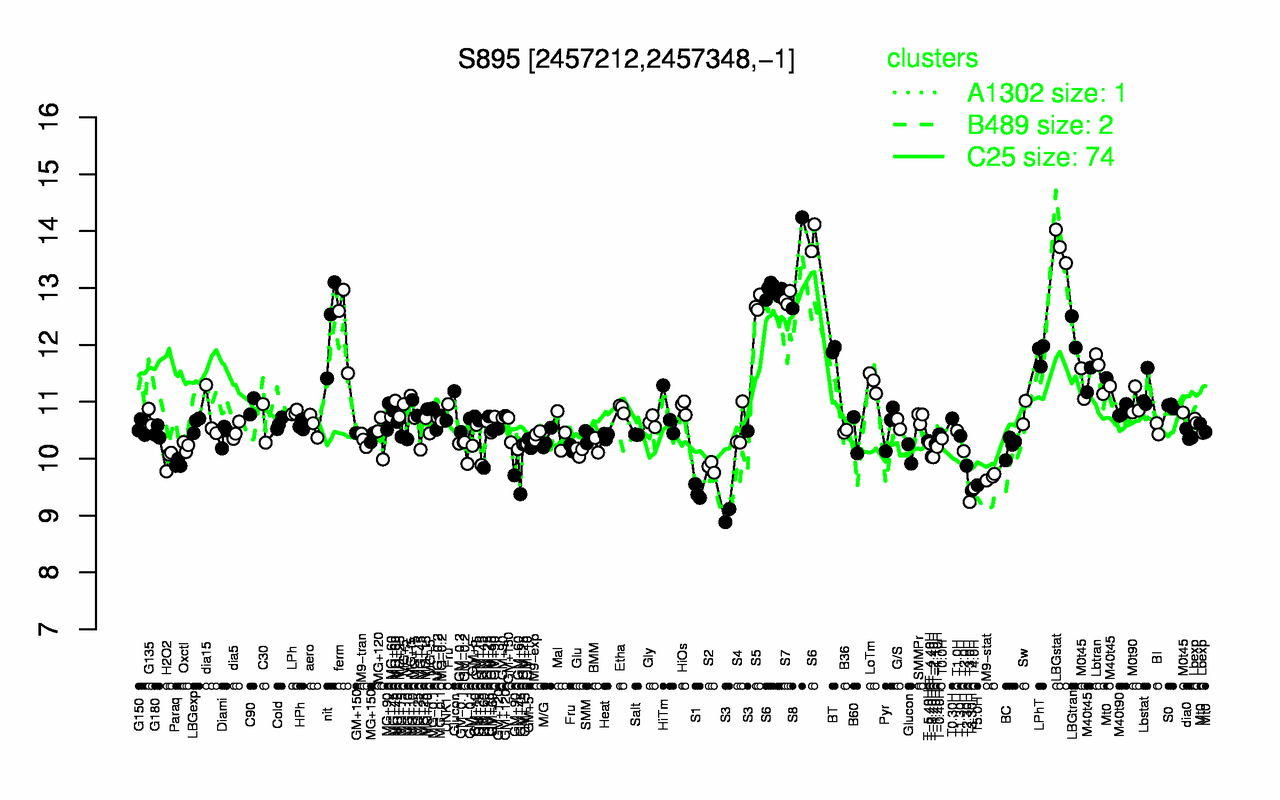
| LBGstat | S8 | S6 | S7 | S5 | ferm | nit | LBGtran | BT | LPhT |
| 13.7 | 13.4 | 13.2 | 12.8 | 12.7 | 12.4 | 12.3 | 12.2 | 11.9 | 11.8 |
| T3.0H | S1 | T3.30H | T4.0H | S3 | T5.0H | M9-stat | S2 | T2.30H | GM+45 |
| 9.24 | 9.41 | 9.44 | 9.48 | 9.49 | 9.53 | 9.68 | 9.85 | 9.88 | 9.91 |