B. subtilis Expression Data Browser
Start Page
B. subtilis Expression Data Browser
Gene/Segment:
yitF
Locus Tag:
BSU10970
Details about yitF
Show/Hide
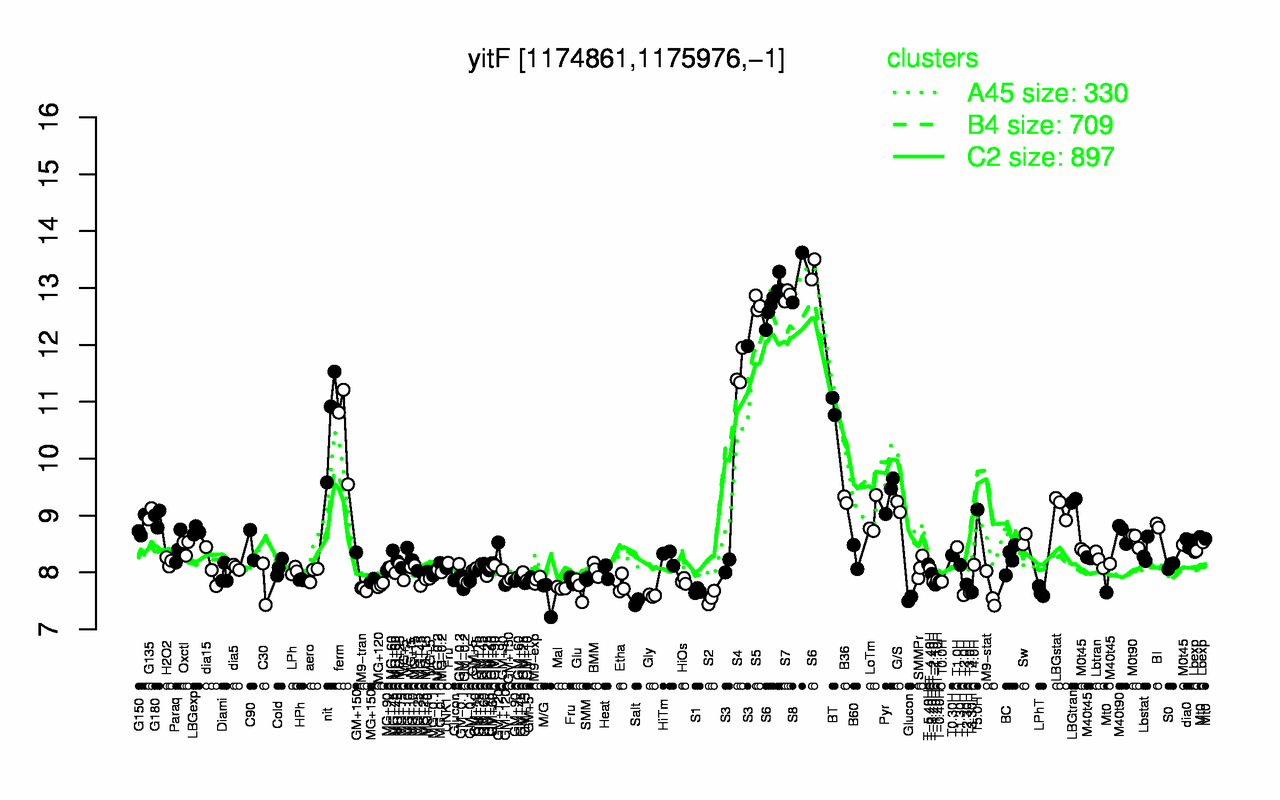
Highest Expression Conditions
S8
S6
S7
S5
S4
BT
nit
ferm
S3
Pyr
13.2
12.9
12.9
12.7
11.6
10.9
10.7
10.5
9.4
9.38
Lowest Expression Conditions
Salt
S2
M/G
Gly
T2.0H
Glucon
T3.0H
T3.30H
LPhT
M9-stat
7.48
7.56
7.59
7.59
7.6
7.64
7.65
7.65
7.66
7.66
Most Positively Correlated Segments
yitG
S109
spoVAF
yngD
ywjD
spoVAEA
ycgH
yveA
S1260
lytH
0.99
0.97
0.96
0.96
0.96
0.96
0.96
0.96
0.95
0.95
Most Negatively Correlated Segments
ykuH
yvbH
S511
yugG
yddK
bceR
yugH
penP
yeeC
bceS
-0.85
-0.85
-0.84
-0.82
-0.81
-0.81
-0.81
-0.81
-0.8
-0.8
Expression Profile of Segment yitF
Show/Hide
Annotation of Gene yitF
Show/Hide
inference
ab initio prediction:AMIGene:2.0
codon_start
1
product
putative enolase superfamily enzyme
transl_table
11
note
Evidence 3: Function proposed based on presence of conserved amino acid motif, structural feature or limited homology; PubMedId: 10960106, 11747447; Product type pe: putative enzyme
db_xref
GI:2633433
protein_id
CAB12937.1
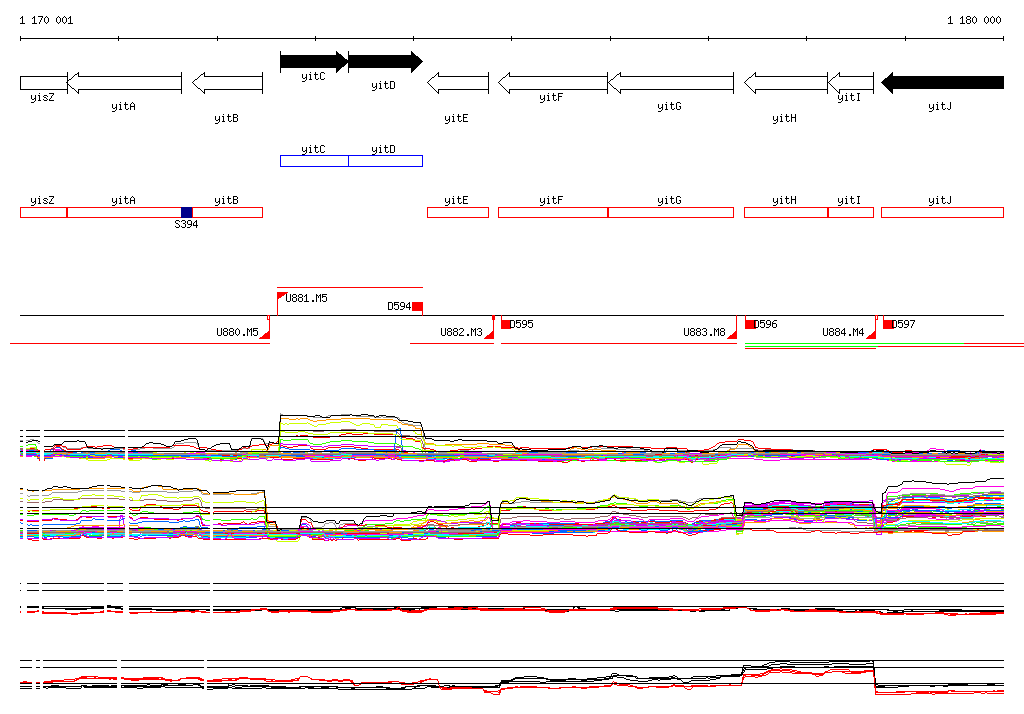
Genomic View of Gene/Segment yitF
Show/Hide
(Legend)
Browse Genome Context