B. subtilis Expression Data Browser
Start Page
B. subtilis Expression Data Browser
Gene/Segment:
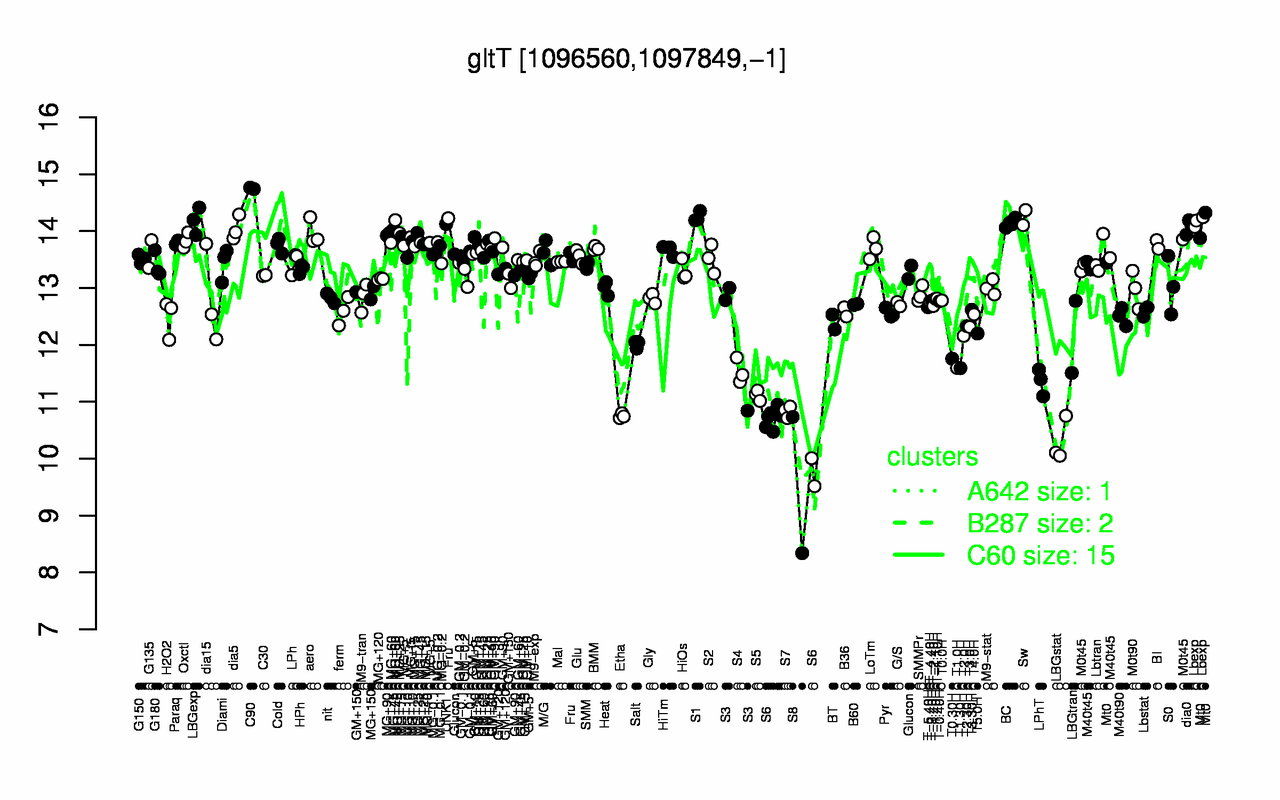
gltT
Locus Tag:
BSU10220
Details about gltT
Show/Hide
Highest Expression Conditions
C90
S1
Sw
LBGexp
Lbexp
BC
UNK1
dia0
dia5
MG+60
14.8
14.2
14.2
14.2
14.2
14.1
14.1
14.1
14
14
Lowest Expression Conditions
S8
LBGstat
S6
Etha
S7
S5
LPhT
S4
T1.30H
T1.0H
9.54
10.3
10.5
10.8
10.8
11.1
11.4
11.5
11.6
11.6
Most Positively Correlated Segments
oxaAA
dtd
relA
guaB
S263
yumC
yfkL
S361
jag
adeC
0.8
0.79
0.78
0.77
0.77
0.76
0.76
0.75
0.75
0.75
Most Negatively Correlated Segments
yndD
S318
S700
yozF
yojJ
yozT
S650
gpr
yetO
S1158
-0.76
-0.75
-0.75
-0.75
-0.74
-0.74
-0.74
-0.74
-0.73
-0.73
Expression Profile of Segment gltT
Show/Hide
Annotation of Gene gltT
Show/Hide
function
16.1: Circulate
inference
ab initio prediction:AMIGene:2.0
codon_start
1
product
proton/sodium-glutamate symport protein
transl_table
11
note
Evidence 2a: Function of homologous gene experimentally demonstrated in an other organism; PubMedId: 15849754, 16850406, 8634258; Product type t : transporter
db_xref
GI:2633358
protein_id
CAB12862.1
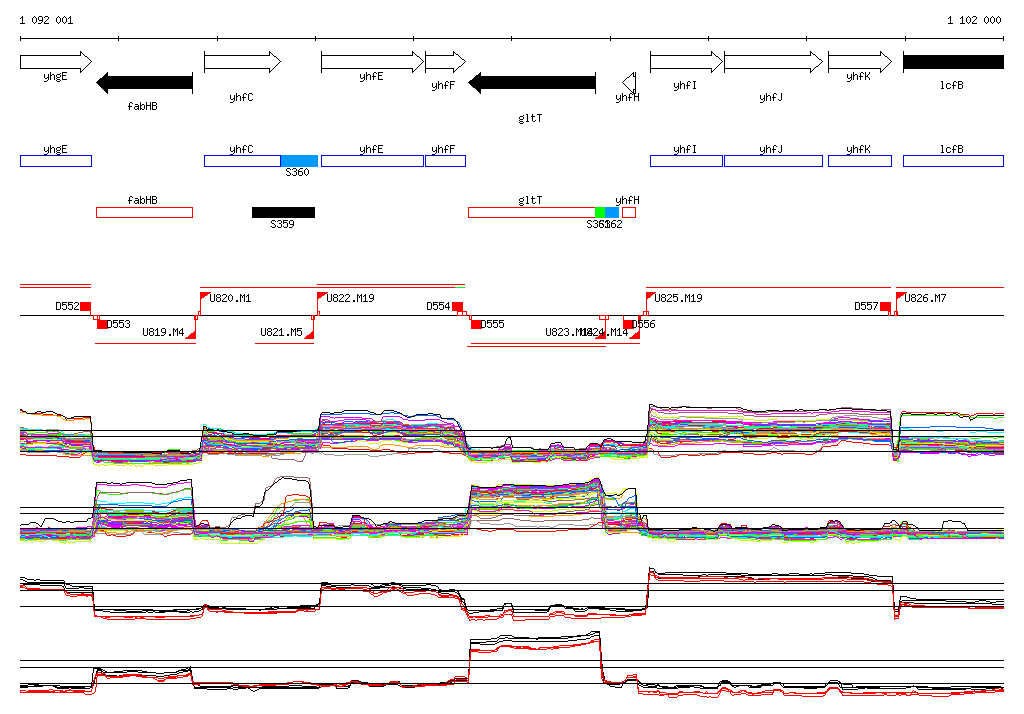
Genomic View of Gene/Segment gltT
Show/Hide
(Legend)
Browse Genome Context