| Start Page |
|
 |
| Start Page |
|
|
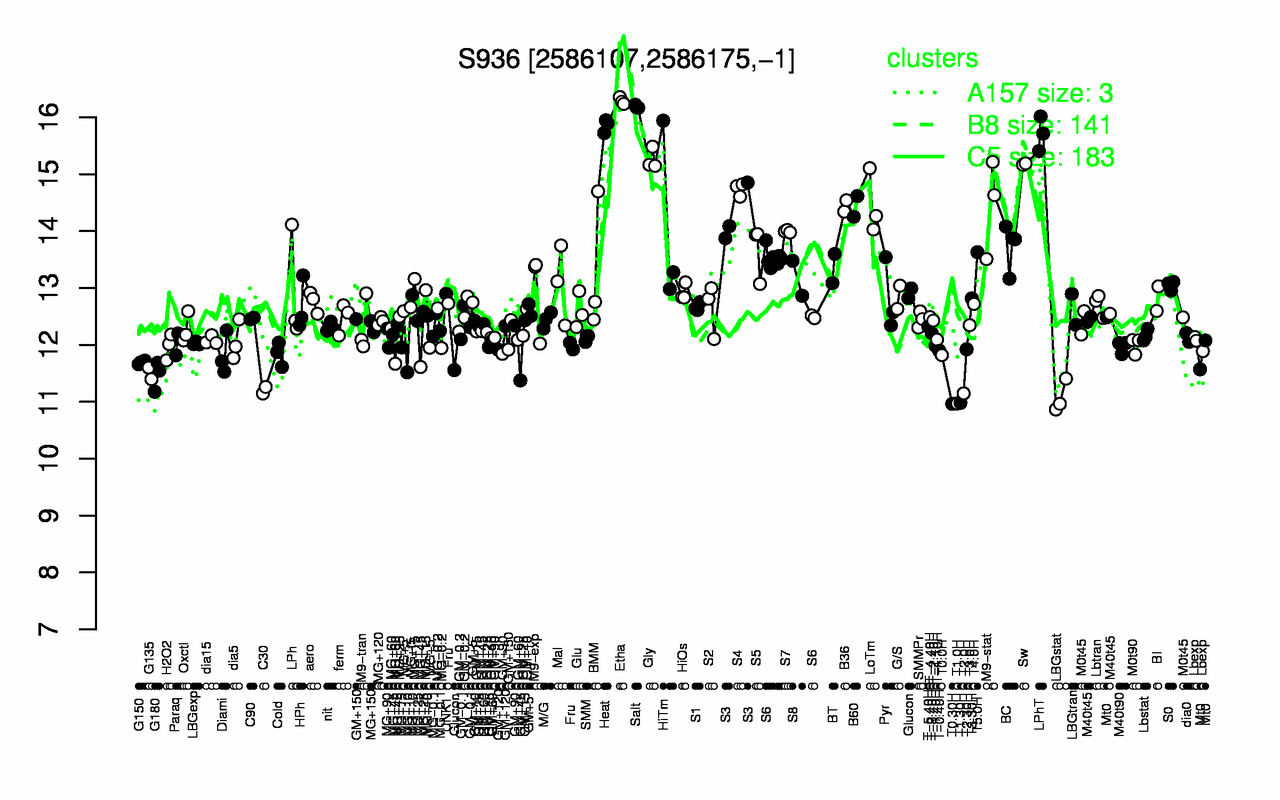
| Etha | Salt | Heat | LPhT | Gly | Sw | S4 | LoTm | M9-stat | B36 |
| 16.3 | 16.2 | 15.9 | 15.7 | 15.3 | 15.2 | 14.7 | 14.5 | 14.5 | 14.4 |
| T0.30H | T1.0H | T1.30H | LBGstat | T2.0H | C30 | G180 | G135 | G150 | T0.0H |
| 11 | 11 | 11 | 11.1 | 11.1 | 11.2 | 11.5 | 11.5 | 11.7 | 11.8 |