| Start Page |
|
 |
| Start Page |
|
|
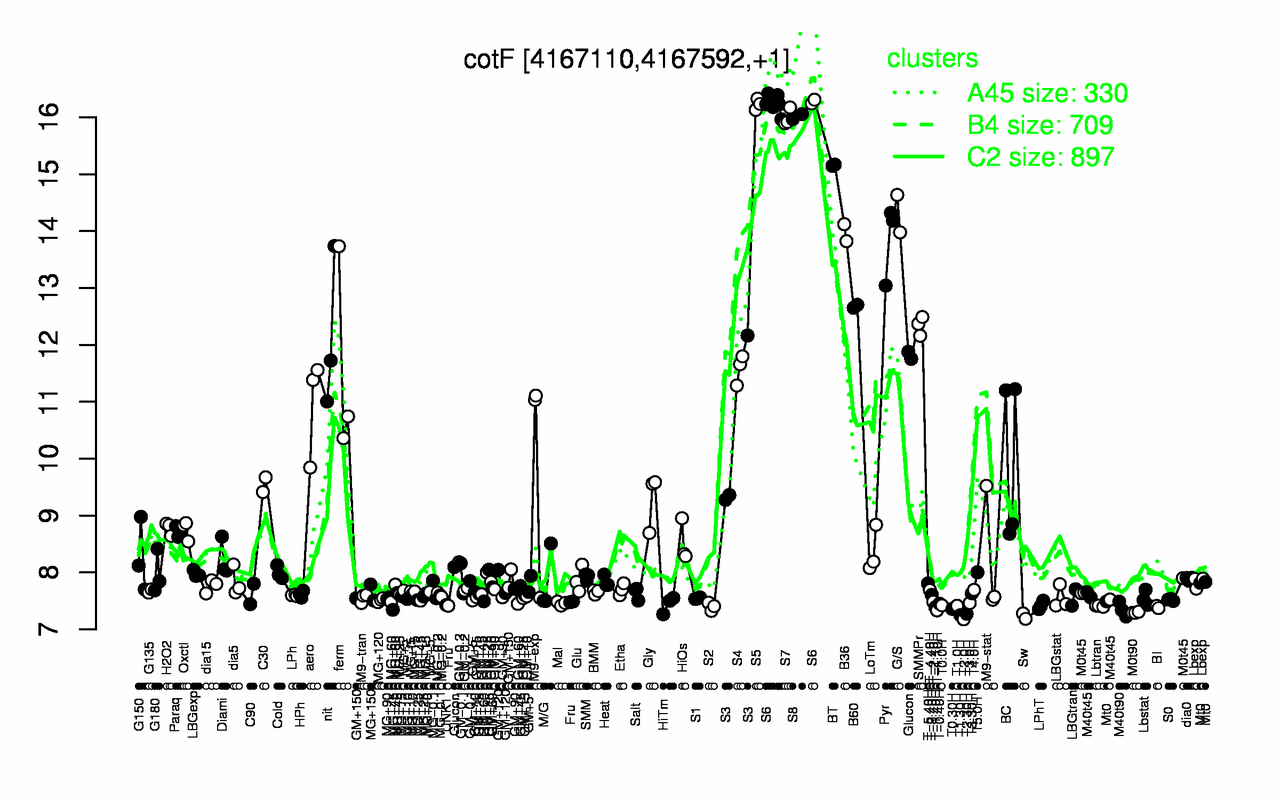
| S6 | S5 | S8 | S7 | BT | G/S | B36 | Pyr | B60 | SMMPr |
| 16.3 | 16.2 | 16 | 16 | 15.2 | 14.3 | 14 | 13.8 | 12.7 | 12.3 |
| T2.0H | Sw | T1.30H | T2.30H | M0t90 | T-1.10H | M40t90 | T0.30H | T-1.40H | BI |
| 7.18 | 7.23 | 7.25 | 7.27 | 7.3 | 7.33 | 7.35 | 7.36 | 7.39 | 7.39 |