| Start Page |
|
 |
| Start Page |
|
|
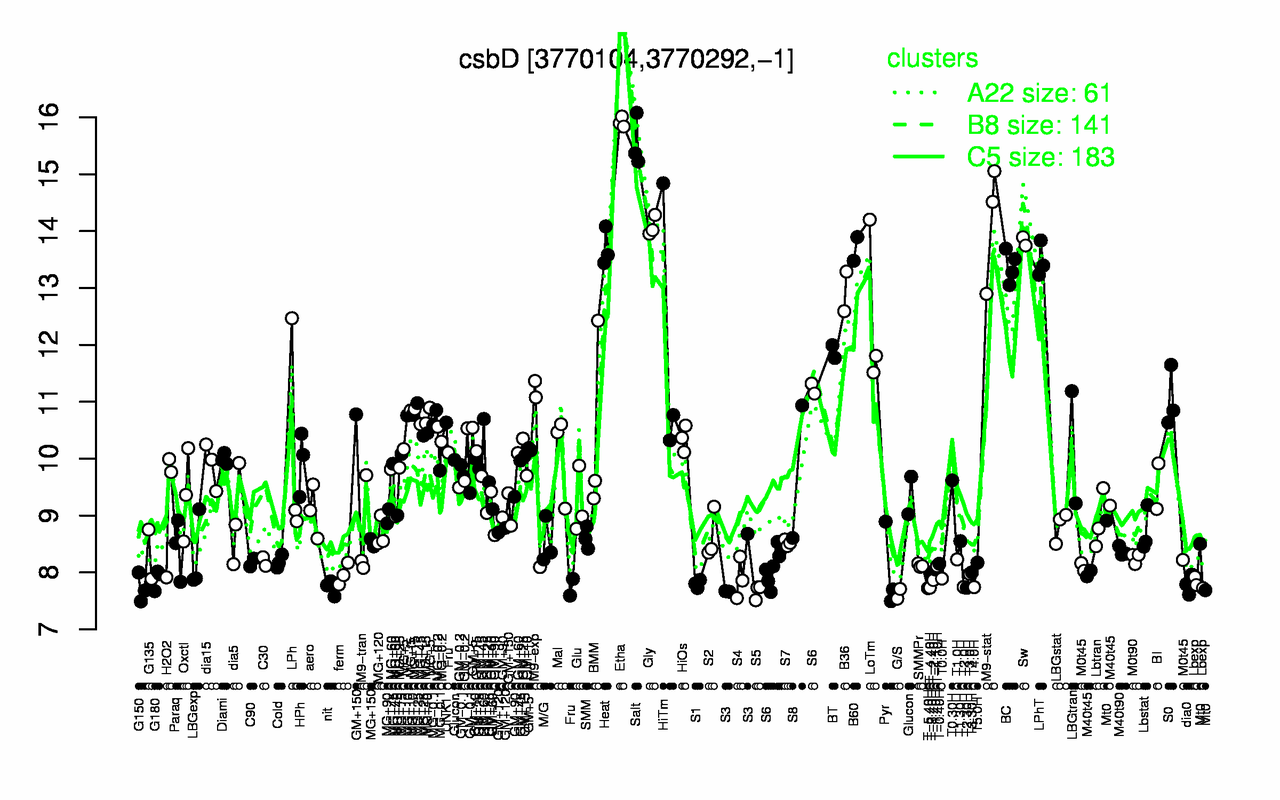
| Etha | Salt | M9-stat | Gly | Sw | Heat | B60 | LPhT | BC | B36 |
| 15.9 | 15.6 | 14.2 | 14.1 | 13.8 | 13.7 | 13.7 | 13.5 | 13.4 | 12.9 |
| G/S | S5 | T-5.40H | G150 | T2.30H | T-4.40H | nit | T4.0H | T2.0H | dia0 |
| 7.62 | 7.66 | 7.72 | 7.72 | 7.73 | 7.73 | 7.73 | 7.74 | 7.74 | 7.79 |