| Start Page |
|
 |
| Start Page |
|
|
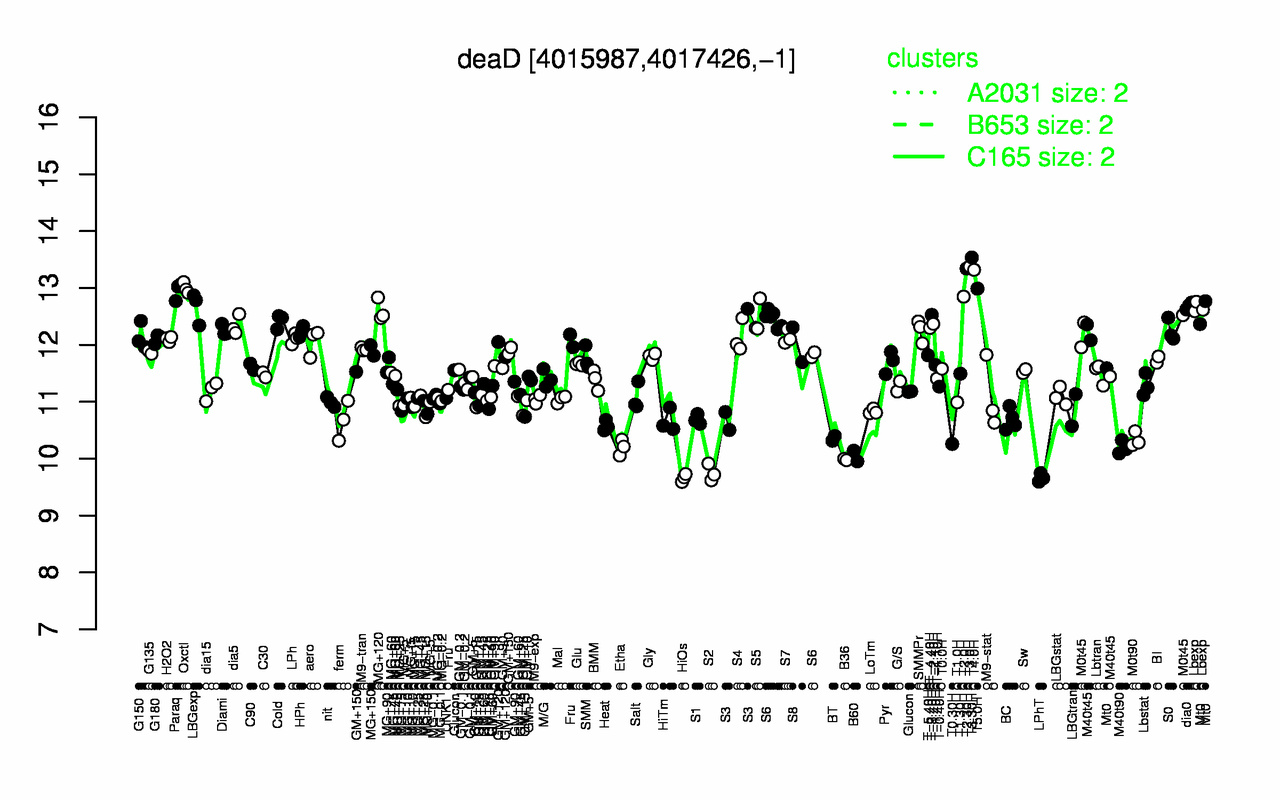
| T3.30H | T3.0H | T2.30H | T4.0H | Oxctl | T5.0H | Paraq | T2.0H | dia0 | LBGexp |
| 13.5 | 13.4 | 13.3 | 13.3 | 13 | 13 | 13 | 12.8 | 12.7 | 12.7 |
| HiOs | LPhT | S2 | B36 | B60 | M40t90 | Etha | T0.30H | M0t90 | BT |
| 9.66 | 9.67 | 9.75 | 9.99 | 10 | 10.2 | 10.2 | 10.3 | 10.3 | 10.4 |