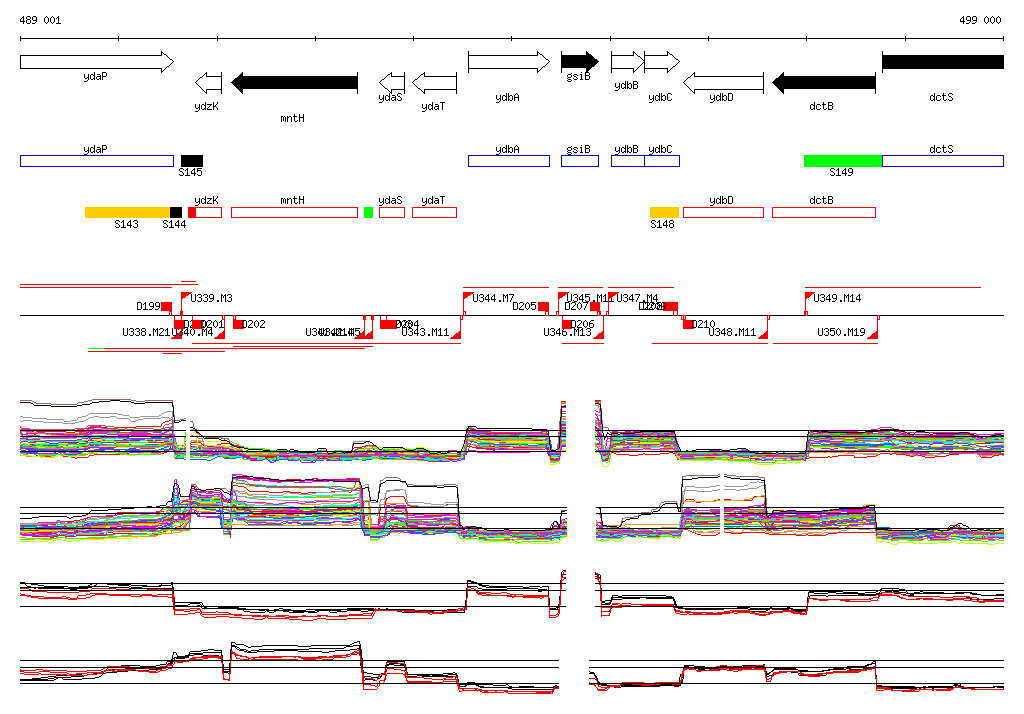
| Start Page |
|
 |
| Start Page |
|
|
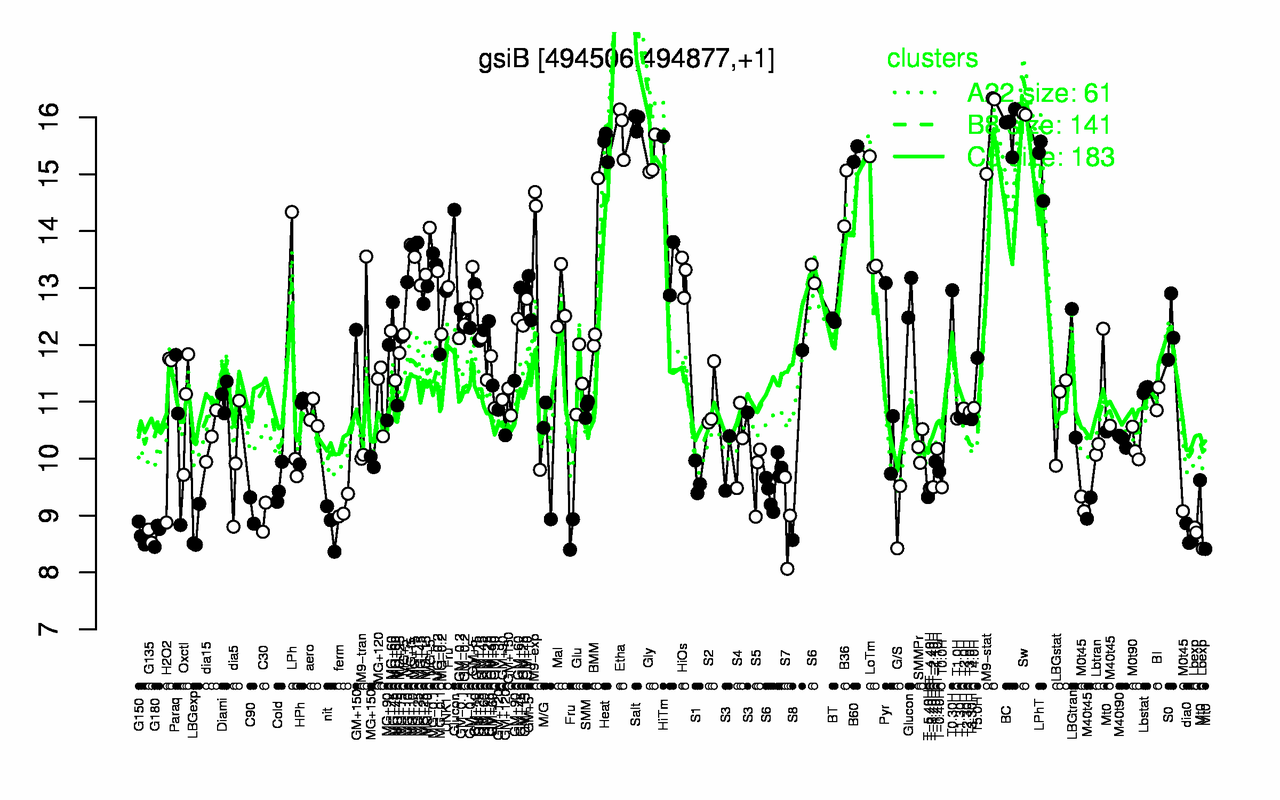
| Sw | Salt | M9-stat | BC | Etha | Heat | B60 | Gly | LPhT | B36 |
| 16.1 | 15.9 | 15.9 | 15.8 | 15.8 | 15.5 | 15.4 | 15.3 | 15.2 | 14.6 |
| Lbexp | G135 | dia0 | G150 | G180 | LBGexp | nit | S7 | G/S | C30 |
| 8.64 | 8.64 | 8.64 | 8.68 | 8.68 | 8.73 | 8.82 | 8.91 | 8.97 | 8.97 |