| Start Page |
|
 |
| Start Page |
|
|
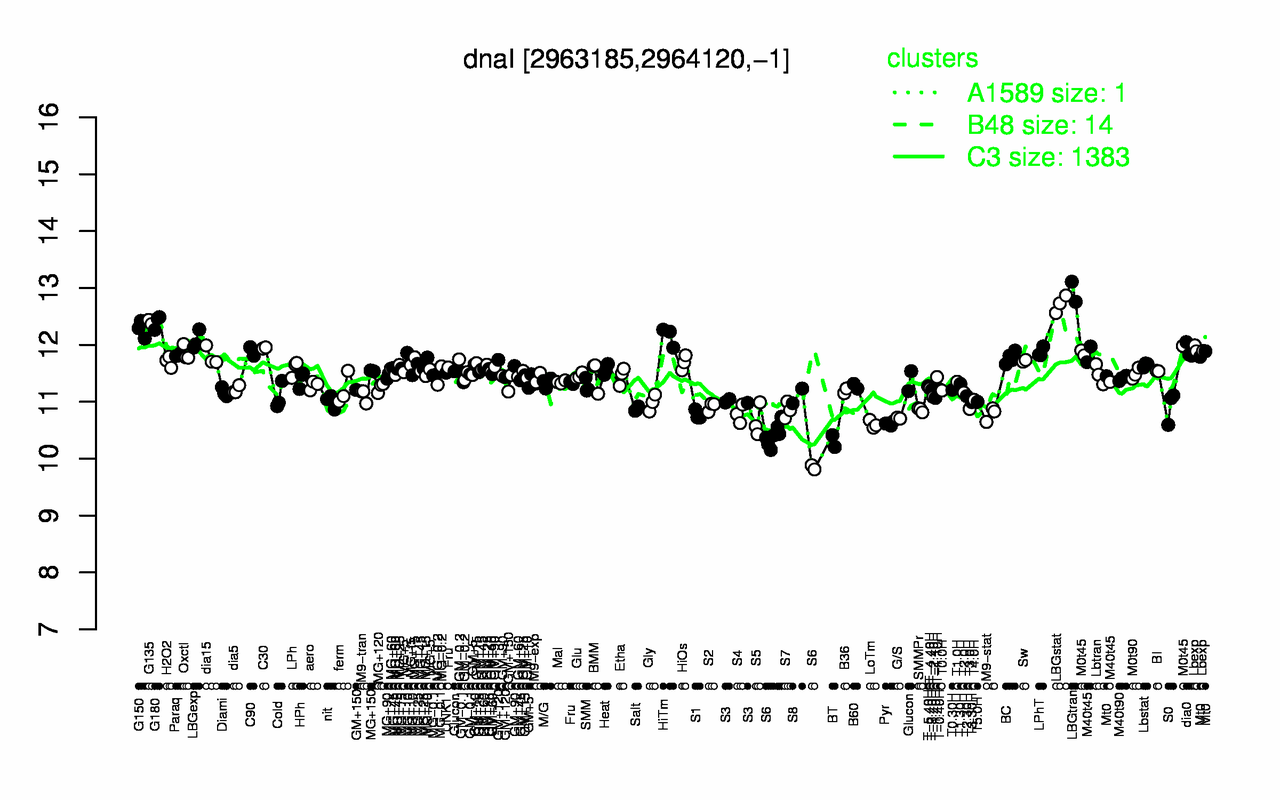
| LBGtran | LBGstat | G180 | G135 | G150 | HiTm | LBGexp | C30 | Lbexp | M0t45 |
| 12.9 | 12.7 | 12.4 | 12.4 | 12.3 | 12.2 | 12.1 | 11.9 | 11.9 | 11.9 |
| S6 | BT | LoTm | Pyr | S5 | G/S | S1 | M9-stat | S4 | S7 |
| 10.3 | 10.3 | 10.6 | 10.6 | 10.7 | 10.7 | 10.8 | 10.8 | 10.8 | 10.9 |