B. subtilis Expression Data Browser
Start Page
B. subtilis Expression Data Browser
Gene/Segment:
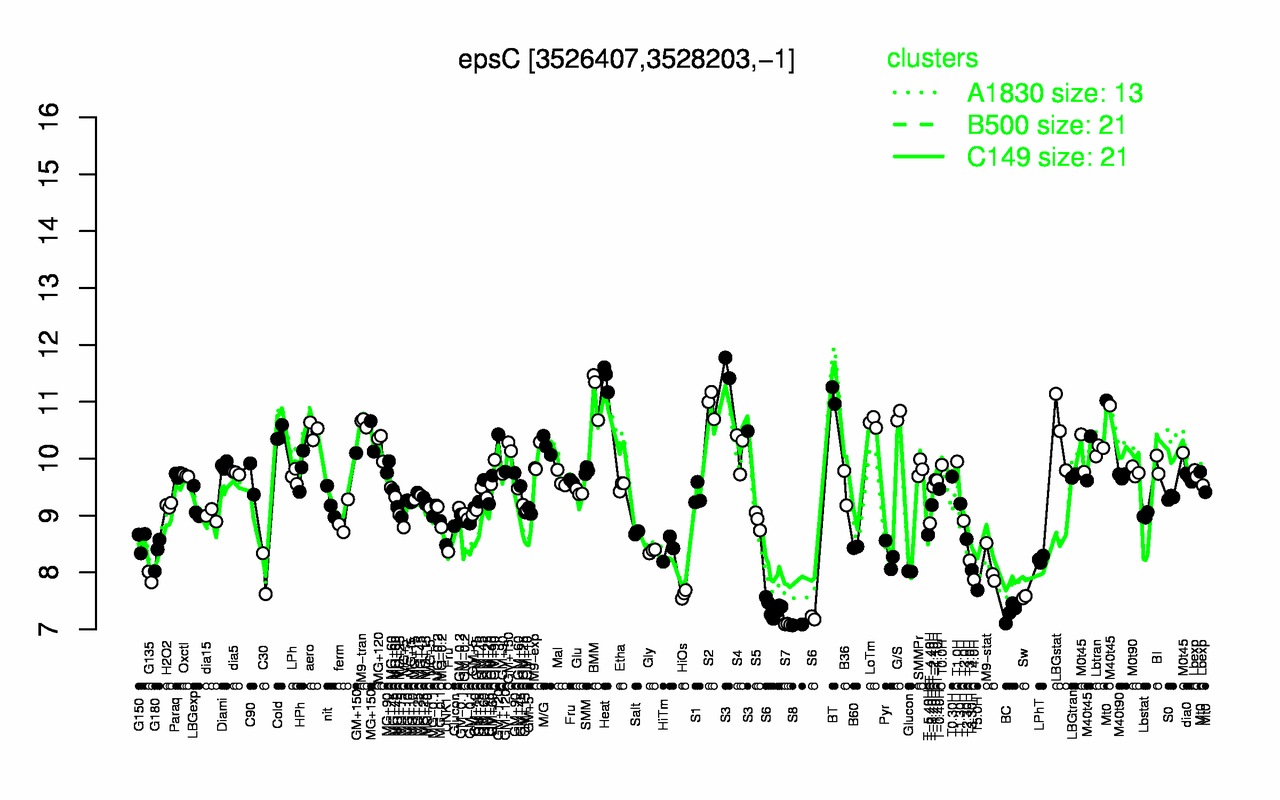
epsC
Locus Tag:
BSU34350
Details about epsC
Show/Hide
Highest Expression Conditions
Heat
S3
BMM
BT
S2
G/S
LoTm
M9-tran
aero
LBGstat
11.4
11.2
11.2
11.1
11
10.8
10.6
10.6
10.5
10.5
Lowest Expression Conditions
S8
S7
BC
S6
Sw
HiOs
T5.0H
T4.0H
G135
C30
7.08
7.09
7.3
7.34
7.57
7.62
7.69
7.87
7.92
7.98
Most Positively Correlated Segments
epsD
epsE
epsF
epsG
epsH
epsI
epsL
epsJ
S1312
epsK
0.97
0.93
0.9
0.9
0.9
0.89
0.89
0.89
0.88
0.88
Most Negatively Correlated Segments
S980
S790
ytvB
S17
S58
yczG
scr
ywmA
S743
S1395
-0.58
-0.55
-0.54
-0.53
-0.53
-0.52
-0.52
-0.52
-0.52
-0.51
Expression Profile of Segment epsC
Show/Hide
Annotation of Gene epsC
Show/Hide
function
16.5: Explore
inference
ab initio prediction:AMIGene:2.0
codon_start
1
EC_number
5.1.3.-
transl_table
11
note
Evidence 3: Function proposed based on presence of conserved amino acid motif, structural feature or limited homology; PubMedId: 15661000; Product type pe : putative enzyme
db_xref
GI:2635948
product
putative UDP-sugar epimerase
protein_id
CAB15440.1
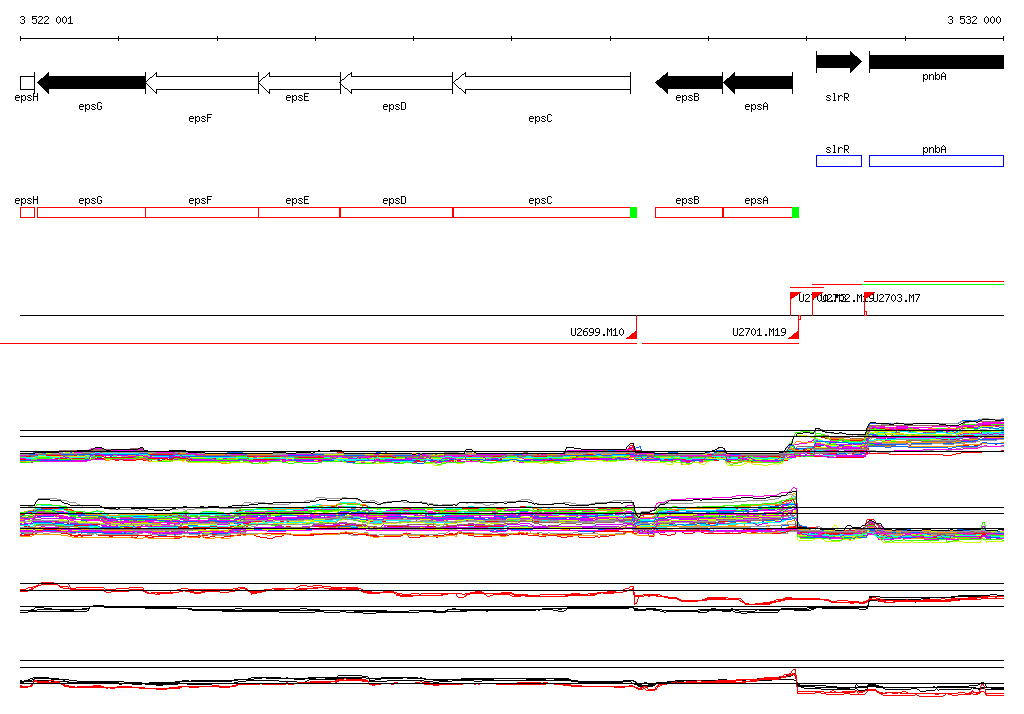
Genomic View of Gene/Segment epsC
Show/Hide
(Legend)
Browse Genome Context