B. subtilis Expression Data Browser
Start Page
B. subtilis Expression Data Browser
Gene/Segment:
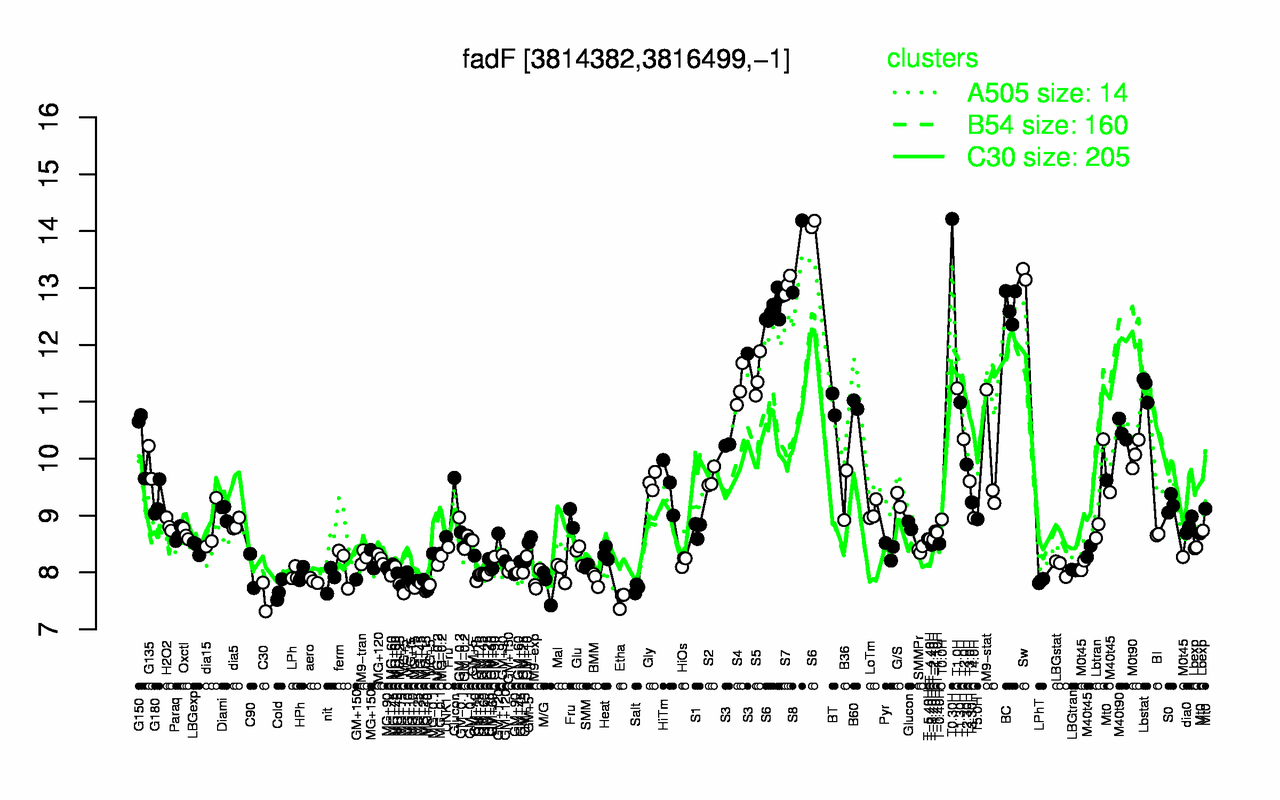
fadF
Locus Tag:
BSU37180
Details about fadF
Show/Hide
Highest Expression Conditions
T0.30H
S8
Sw
S7
S6
BC
S5
S4
Lbstat
T1.0H
14.2
13.6
13.2
13
13
12.7
11.4
11.3
11.2
11.2
Lowest Expression Conditions
Etha
C30
Cold
MG+5
MG+15
Salt
M/G
MG+t5
MG+10
MG+25
7.52
7.57
7.68
7.71
7.72
7.72
7.77
7.77
7.83
7.84
Most Positively Correlated Segments
acdA
S1444
S1443
fadE
fadA
fadN
fadR
etfA
etfB
fadB
0.97
0.96
0.95
0.95
0.94
0.94
0.93
0.93
0.93
0.92
Most Negatively Correlated Segments
nusB
tig
S1069
glyA
yvbX
dapH
S1305
folD
yxkC
S451
-0.82
-0.82
-0.82
-0.81
-0.8
-0.8
-0.8
-0.8
-0.79
-0.79
Expression Profile of Segment fadF
Show/Hide
Annotation of Gene fadF
Show/Hide
function
16.11: Scavenge (Catabolism)
inference
ab initio prediction:AMIGene:2.0
codon_start
1
EC_number
1.-.-.-
transl_table
11
note
Evidence 3: Function proposed based on presence of conserved amino acid motif, structural feature or limited homology; PubMedId: 17189250; Product type pe : putative enzyme
db_xref
GI:2636255
product
putative iron-sulphur-binding reductase
protein_id
CAB15746.1
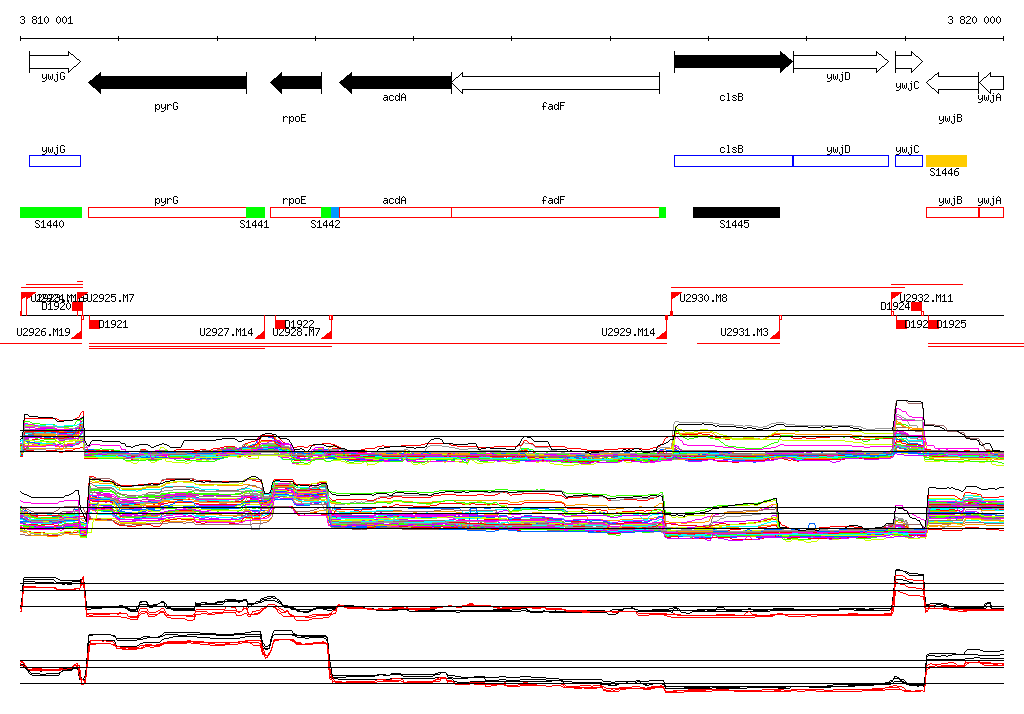
Genomic View of Gene/Segment fadF
Show/Hide
(Legend)
Browse Genome Context