| Start Page |
|
 |
| Start Page |
|
|
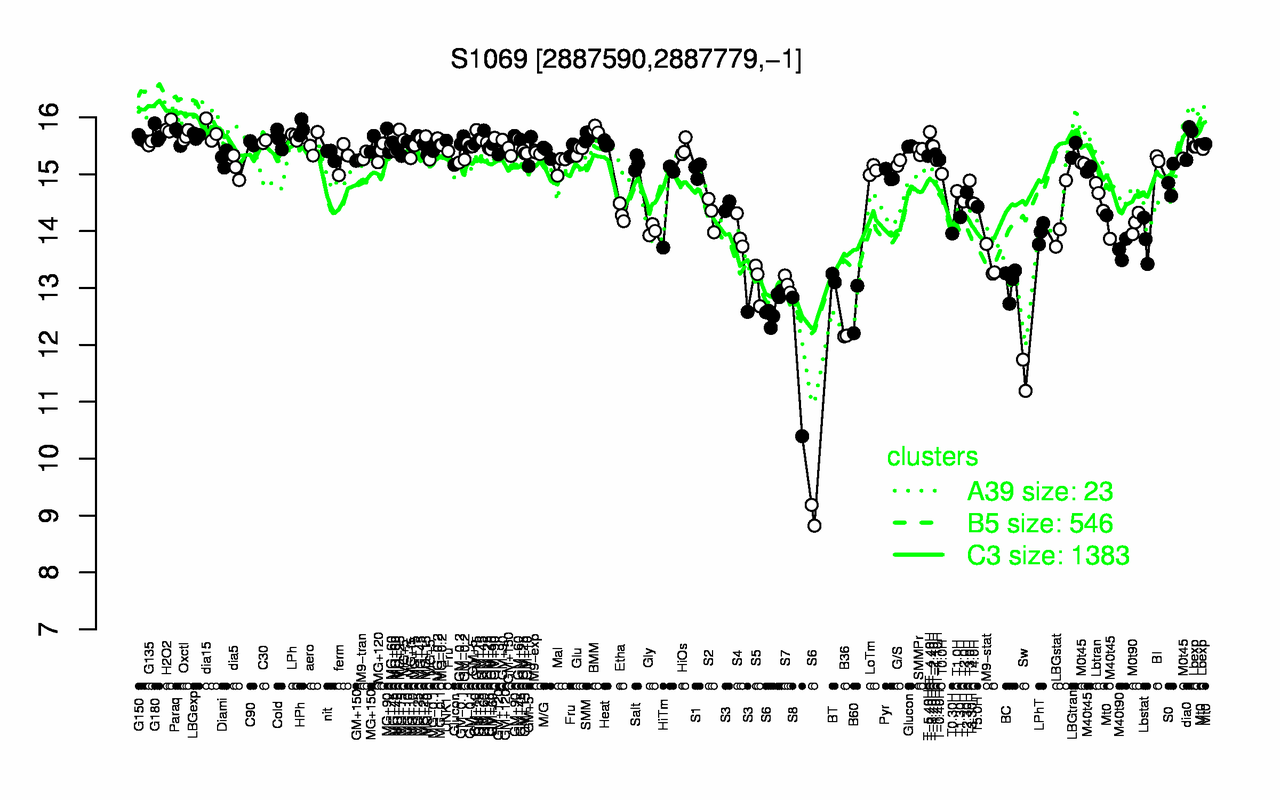
| H2O2 | HPh | BMM | dia15 | T-4.40H | G180 | Paraq | Oxctl | LBGexp | MG+25 |
| 15.8 | 15.8 | 15.8 | 15.8 | 15.7 | 15.7 | 15.7 | 15.7 | 15.7 | 15.7 |
| Sw | S8 | S6 | B36 | B60 | S7 | S5 | BC | BT | M9-stat |
| 11.5 | 11.6 | 11.9 | 12.2 | 12.6 | 13.1 | 13.1 | 13.1 | 13.2 | 13.4 |