| Start Page |
|
 |
| Start Page |
|
|
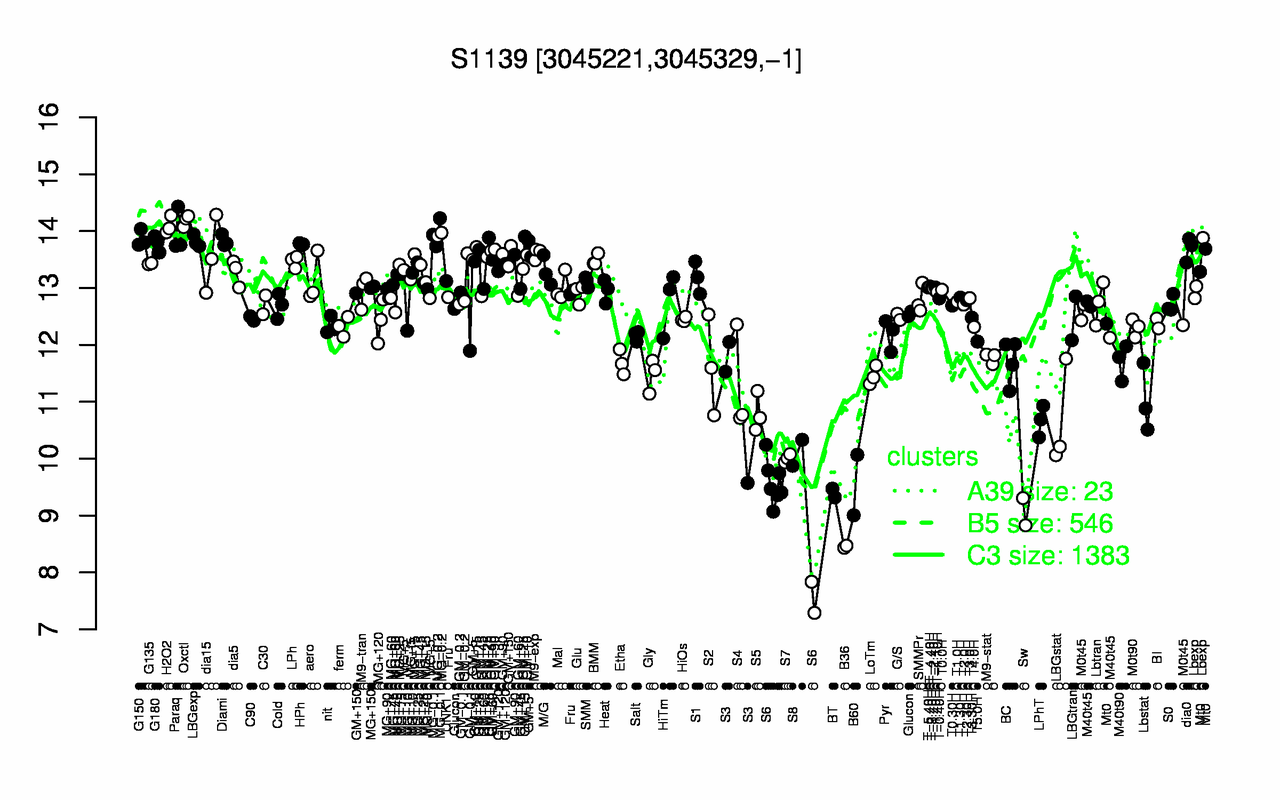
| Oxctl | H2O2 | Paraq | MG-0.1 | MG-0.2 | G150 | GM+15 | Diami | LBGexp | G180 |
| 14.2 | 14.1 | 14 | 14 | 13.9 | 13.9 | 13.8 | 13.8 | 13.8 | 13.8 |
| B36 | Sw | S6 | BT | B60 | S7 | S8 | LPhT | LBGstat | S5 |
| 8.45 | 9.07 | 9.13 | 9.4 | 9.54 | 10 | 10.1 | 10.7 | 10.7 | 10.8 |