B. subtilis Expression Data Browser
Start Page
B. subtilis Expression Data Browser
Gene/Segment:
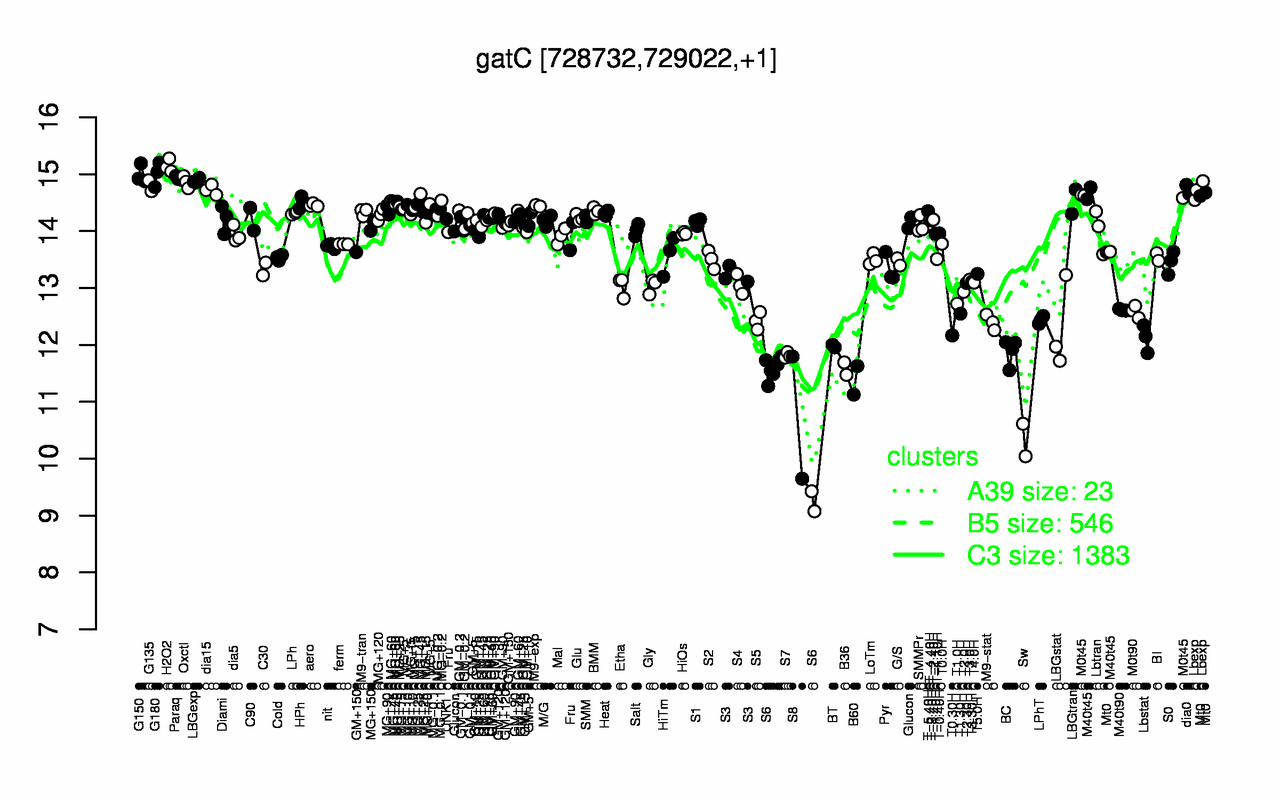
gatC
Locus Tag:
BSU06670
Details about gatC
Show/Hide
Highest Expression Conditions
H2O2
G180
G150
Paraq
LBGexp
Oxctl
G135
dia0
dia15
Lbexp
15.1
15
15
14.9
14.9
14.9
14.8
14.7
14.7
14.7
Lowest Expression Conditions
Sw
S8
S6
B60
B36
S7
BC
BT
Lbstat
T0.30H
10.3
10.7
11.1
11.4
11.6
11.8
11.9
12
12.1
12.2
Most Positively Correlated Segments
gatA
S1069
tig
S237
S587
hepS
S859
hepT
yhcH
S1139
0.94
0.93
0.93
0.91
0.9
0.9
0.89
0.89
0.88
0.88
Most Negatively Correlated Segments
fadE
fadN
fadA
fadR
yqhP
yxiO
etfB
spoIISB
fadB
lcfA
-0.85
-0.85
-0.84
-0.8
-0.8
-0.79
-0.79
-0.79
-0.78
-0.78
Expression Profile of Segment gatC
Show/Hide
Annotation of Gene gatC
Show/Hide
function
16.2: Construct biomass (Anabolism)
inference
ab initio prediction:AMIGene:2.0
codon_start
1
product
glutamyl-tRNA(Gln) amidotransferase (subunit C)
transl_table
11
note
Evidence 1a: Function experimentally demonstrated in the studied strain; PubMedId: 11445070, 12682299, 9342321; Product type e: enzyme
db_xref
GI:2632981
protein_id
CAB12487.1
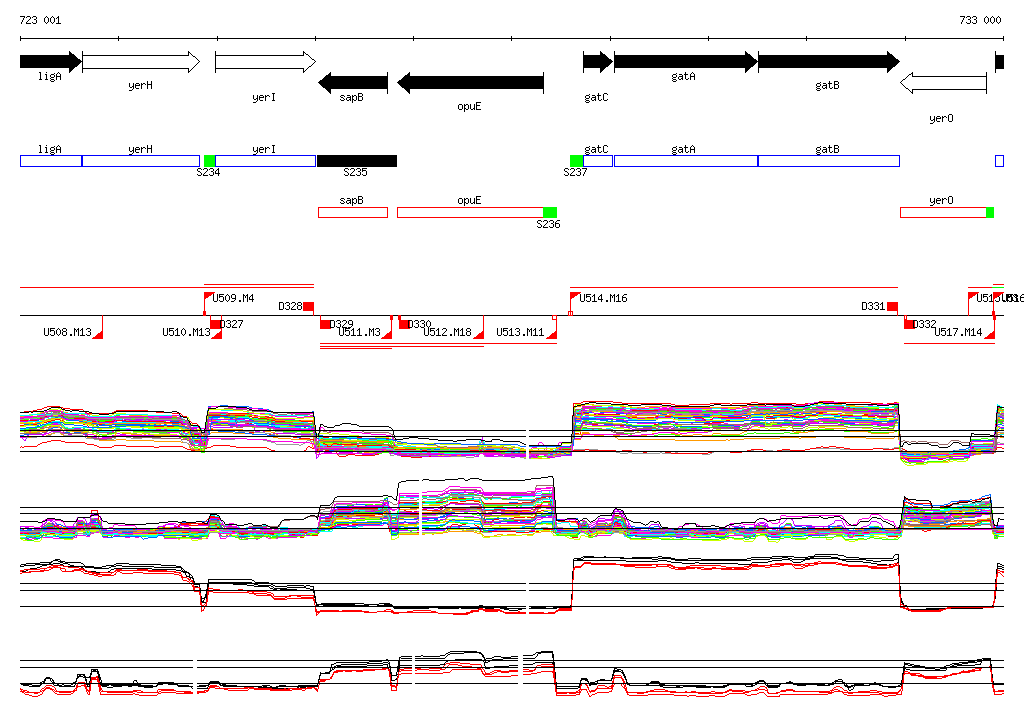
Genomic View of Gene/Segment gatC
Show/Hide
(Legend)
Browse Genome Context