B. subtilis Expression Data Browser
Start Page
B. subtilis Expression Data Browser
Gene/Segment:
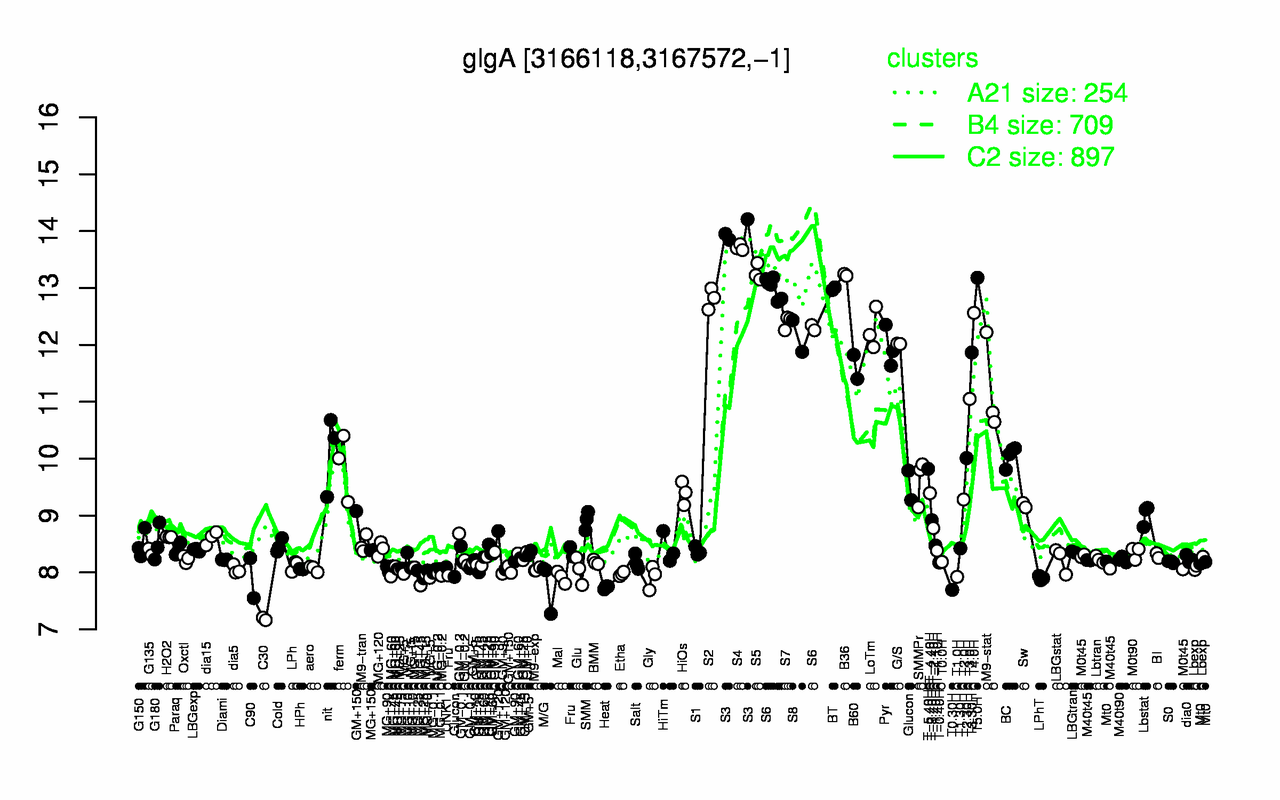
glgA
Locus Tag:
BSU30950
Details about glgA
Show/Hide
Highest Expression Conditions
S3
S4
S5
B36
T5.0H
BT
S6
S2
T4.0H
S7
14
13.7
13.3
13.2
13.2
13
12.8
12.8
12.6
12.4
Lowest Expression Conditions
C30
T0.30H
Heat
M/G
C90
LPhT
Mal
Gly
T1.0H
MG+5
7.18
7.69
7.74
7.79
7.9
7.9
7.92
7.92
7.92
7.94
Most Positively Correlated Segments
glgD
glgC
glgP
glgB
sigG
prkA
spoIVA
spoIIIAH
spoIIIAG
S538
1
1
0.99
0.99
0.97
0.96
0.96
0.96
0.95
0.95
Most Negatively Correlated Segments
sbcD
S378
yrrL
yabN
S1129
yddS
yvrG
yuxH
sbcC
sigD
-0.86
-0.85
-0.84
-0.84
-0.84
-0.84
-0.83
-0.83
-0.83
-0.83
Expression Profile of Segment glgA
Show/Hide
Annotation of Gene glgA
Show/Hide
function
16.14: Store
inference
ab initio prediction:AMIGene:2.0
codon_start
1
EC_number
2.4.1.21
transl_table
11
note
Evidence 1a: Function experimentally demonstrated in the studied strain; PubMedId: 15272305, 8145641; Product type e: enzyme
db_xref
GI:2635579
product
bacterial glycogen (starch) synthase
protein_id
CAB15073.1
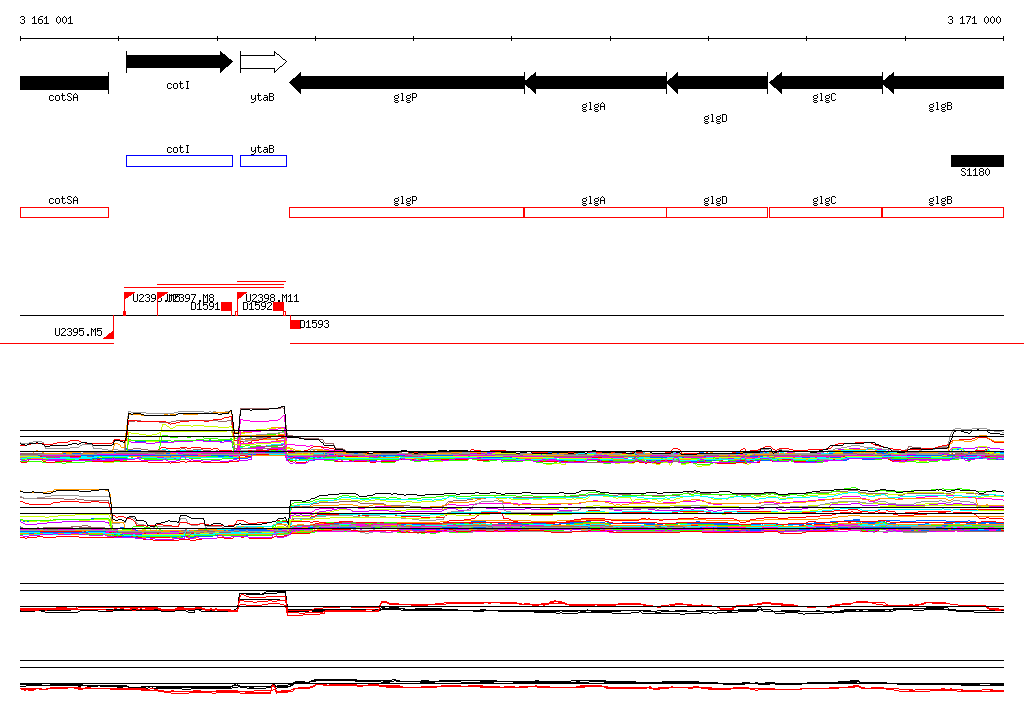
Genomic View of Gene/Segment glgA
Show/Hide
(Legend)
Browse Genome Context