B. subtilis Expression Data Browser
Start Page
B. subtilis Expression Data Browser
Gene/Segment:
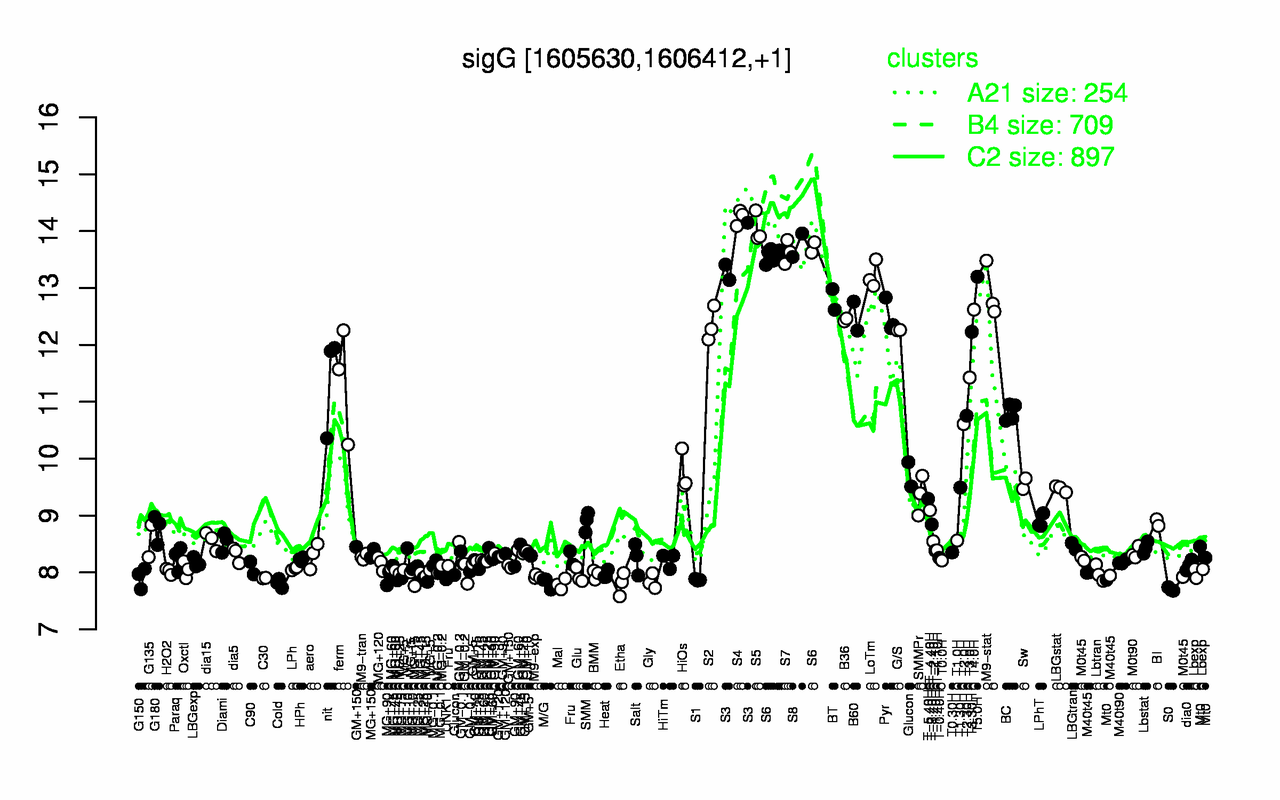
sigG
Locus Tag:
BSU15330
Details about sigG
Show/Hide
Highest Expression Conditions
S4
S5
S8
S7
S6
S3
LoTm
T5.0H
M9-stat
BT
14.2
14
13.8
13.6
13.6
13.6
13.2
13.2
12.9
12.8
Lowest Expression Conditions
S0
Mal
Etha
Cold
M/G
Gly
MG+15
S1
UNK1
MG+90
7.71
7.79
7.8
7.81
7.82
7.84
7.87
7.87
7.88
7.89
Most Positively Correlated Segments
glgC
spoIVA
glgB
glgD
glgA
prkA
dacF
S538
yozN
spoVID
0.98
0.97
0.97
0.97
0.97
0.97
0.96
0.96
0.96
0.96
Most Negatively Correlated Segments
sbcD
S378
yvrG
yabN
yddS
S1129
yvrH
yxkI
yuxH
cheC
-0.89
-0.89
-0.88
-0.86
-0.86
-0.86
-0.85
-0.85
-0.85
-0.85
Expression Profile of Segment sigG
Show/Hide
Annotation of Gene sigG
Show/Hide
function
16.3: Control
inference
ab initio prediction:AMIGene:2.0
codon_start
1
product
RNA polymerase sporulation-specific sigma factor (sigma-G)
transl_table
11
note
Evidence 1a: Function experimentally demonstrated in the studied strain; PubMedId: 15187183, 15256570, 16166546, 16497325, 17015665; Product type f: factor
db_xref
GI:2633906
protein_id
CAB13407.1
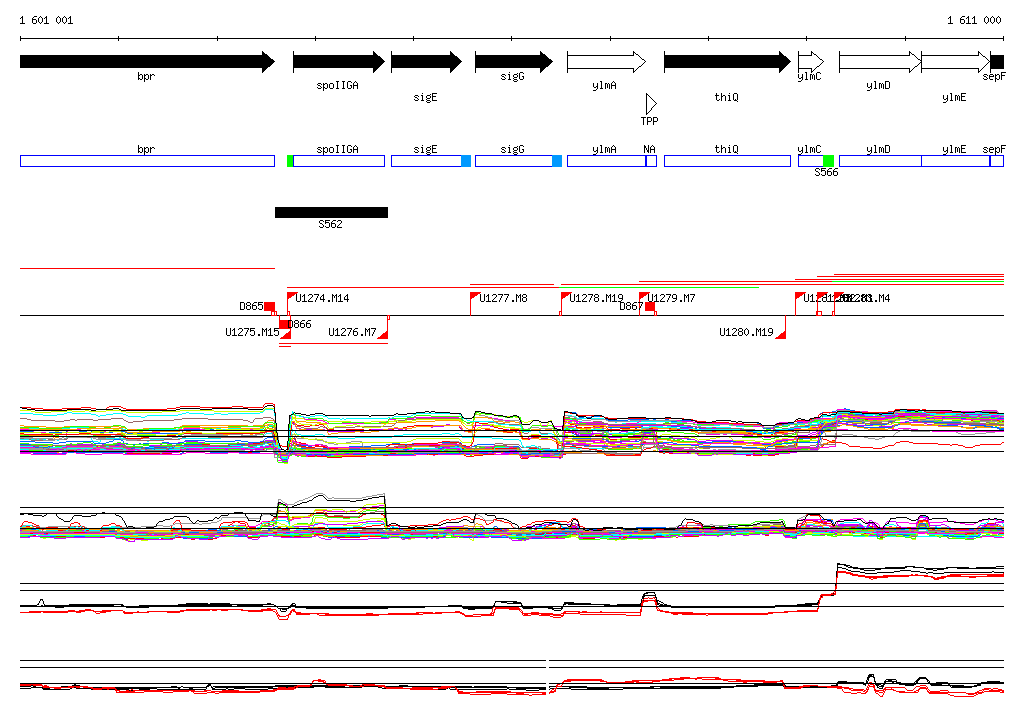
Genomic View of Gene/Segment sigG
Show/Hide
(Legend)
Browse Genome Context