| Start Page |
|
 |
| Start Page |
|
|
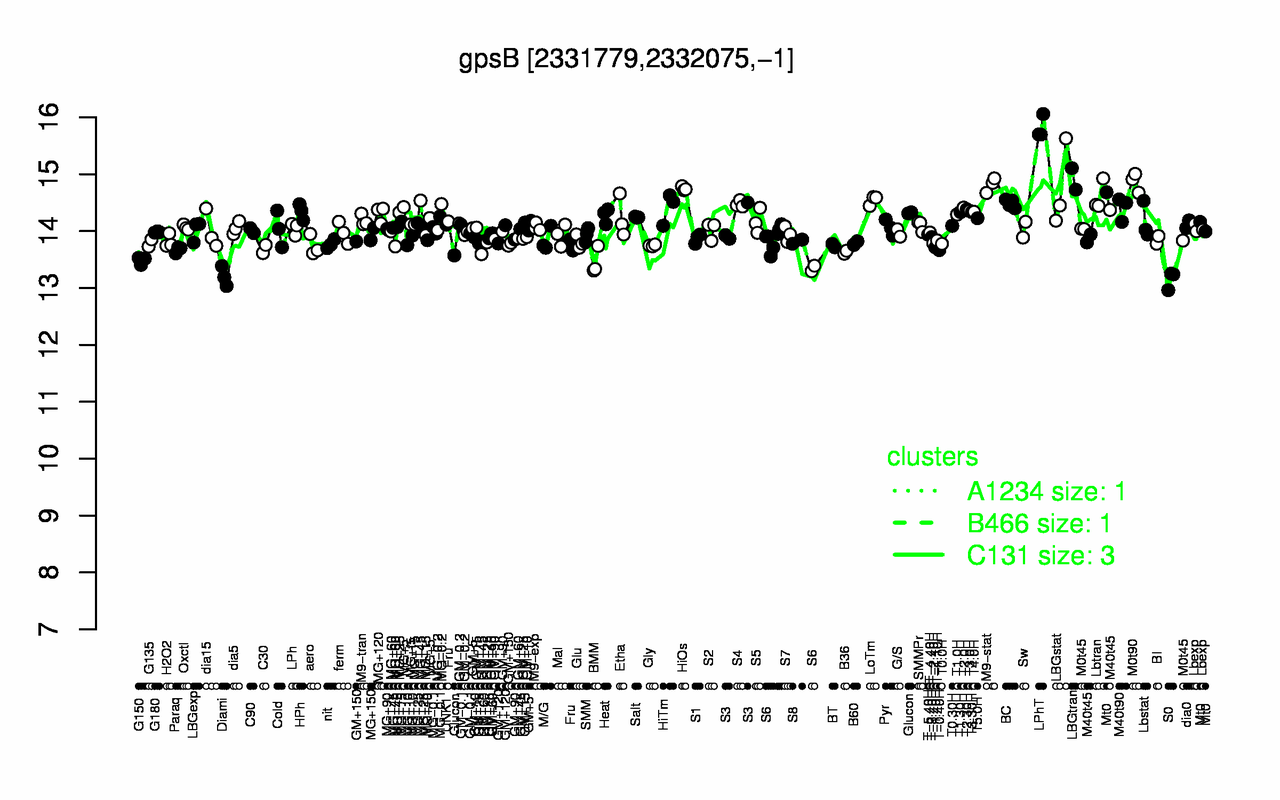
| LPhT | LBGtran | M0t90 | M9-stat | LBGstat | HiOs | Lbtran | LoTm | BC | S4 |
| 15.8 | 14.9 | 14.9 | 14.8 | 14.8 | 14.7 | 14.6 | 14.5 | 14.5 | 14.5 |
| S0 | Diami | BMM | G150 | B36 | T-0.40H | Paraq | C30 | T-1.40H | aero |
| 13.2 | 13.2 | 13.5 | 13.5 | 13.6 | 13.7 | 13.7 | 13.7 | 13.7 | 13.7 |