| Start Page |
|
 |
| Start Page |
|
|
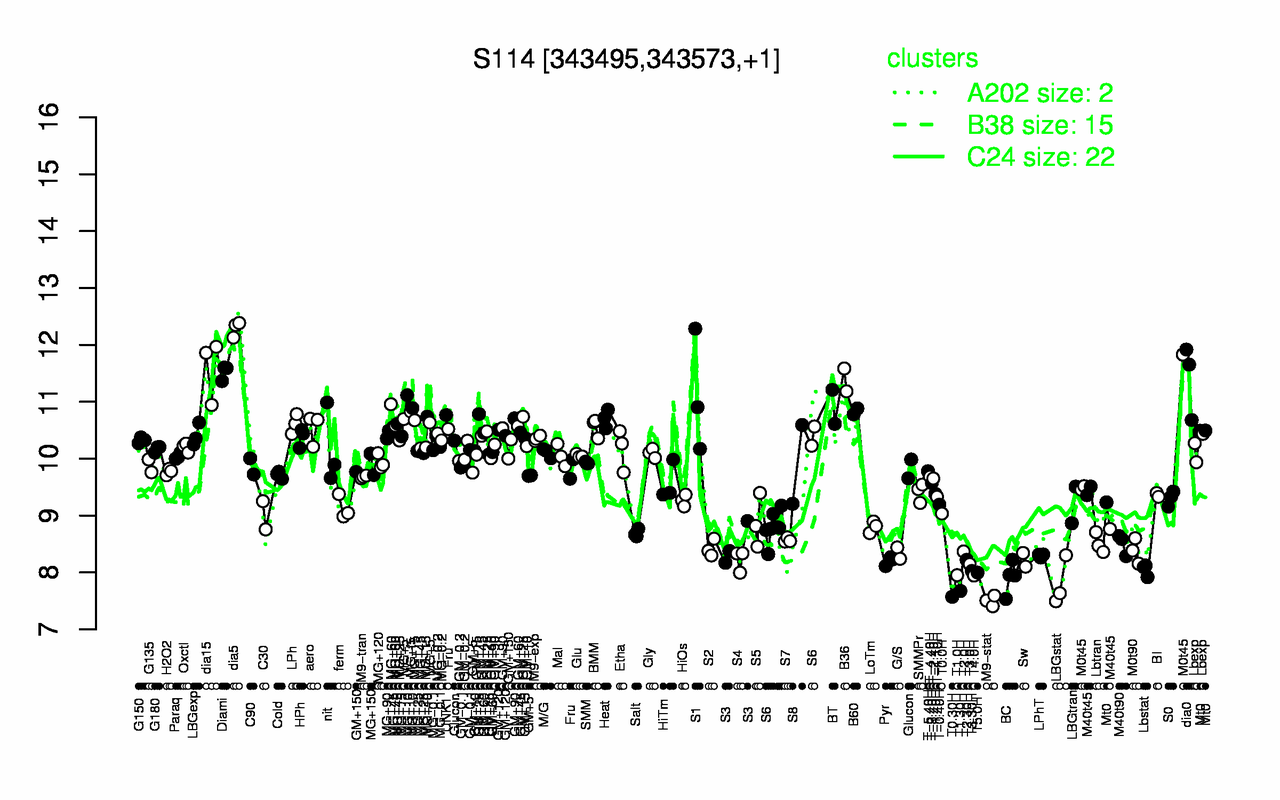
| dia5 | dia15 | Diami | dia0 | B36 | S1 | MG+10 | BT | B60 | MG+t5 |
| 12.3 | 11.6 | 11.5 | 11.4 | 11.4 | 11.1 | 10.9 | 10.9 | 10.8 | 10.8 |
| M9-stat | T0.30H | T1.30H | LBGstat | BC | T4.0H | T1.0H | T5.0H | T3.30H | Lbstat |
| 7.5 | 7.57 | 7.67 | 7.81 | 7.92 | 7.95 | 7.95 | 8 | 8.03 | 8.05 |