B. subtilis Expression Data Browser
Start Page
B. subtilis Expression Data Browser
Gene/Segment:
tcyP
Locus Tag:
BSU09130
Details about tcyP
Show/Hide
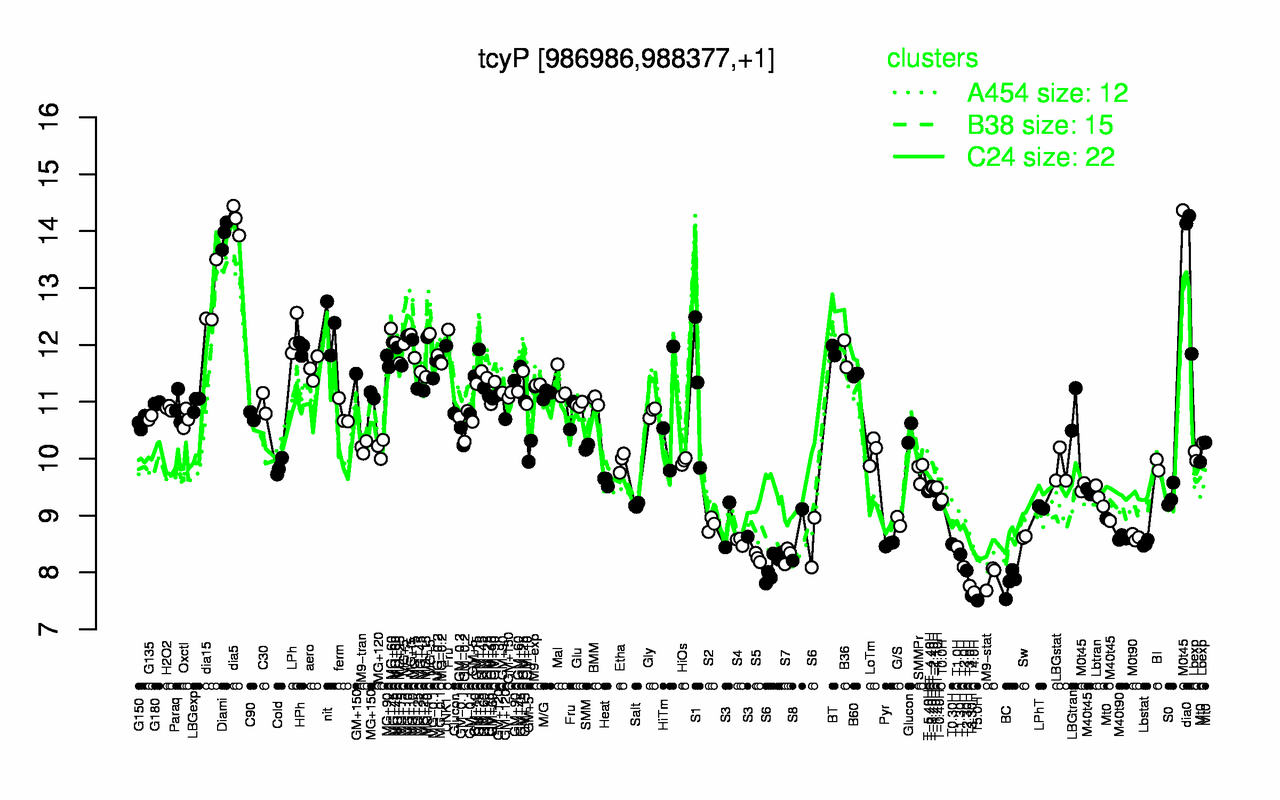
Highest Expression Conditions
dia5
Diami
dia0
dia15
nit
MG+t5
MG+60
LPh
MG+10
MG+5
14.2
13.9
13.4
12.8
12.3
12.2
12.2
12.1
12.1
12.1
Lowest Expression Conditions
T5.0H
T3.30H
T4.0H
T3.0H
BC
M9-stat
T2.30H
T2.0H
S6
S5
7.51
7.59
7.65
7.76
7.82
7.93
8.04
8.09
8.21
8.26
Most Positively Correlated Segments
yxeN
yxeM
yxeQ
yxeO
yxeL
yxeP
yxeK
S114
yxeR
yrrT
0.89
0.89
0.89
0.89
0.89
0.89
0.88
0.87
0.86
0.86
Most Negatively Correlated Segments
ggt
ylbA
S727
S725
yobO
dhaS
S663
S744
yqhP
yhaR
-0.71
-0.71
-0.7
-0.7
-0.7
-0.69
-0.69
-0.69
-0.67
-0.67
Expression Profile of Segment tcyP
Show/Hide
Annotation of Gene tcyP
Show/Hide
inference
ab initio prediction:AMIGene:2.0
codon_start
1
product
sodium-cystine symporter
transl_table
11
note
Evidence 1a: Function experimentally demonstrated in the studied strain; PubMedId: 15262924, 15849754, 16850406; Product type t: transporter
db_xref
GI:2633236
protein_id
CAB12741.1
Genomic View of Gene/Segment tcyP
Show/Hide
(Legend)
Browse Genome Context