| Start Page |
|
 |
| Start Page |
|
|
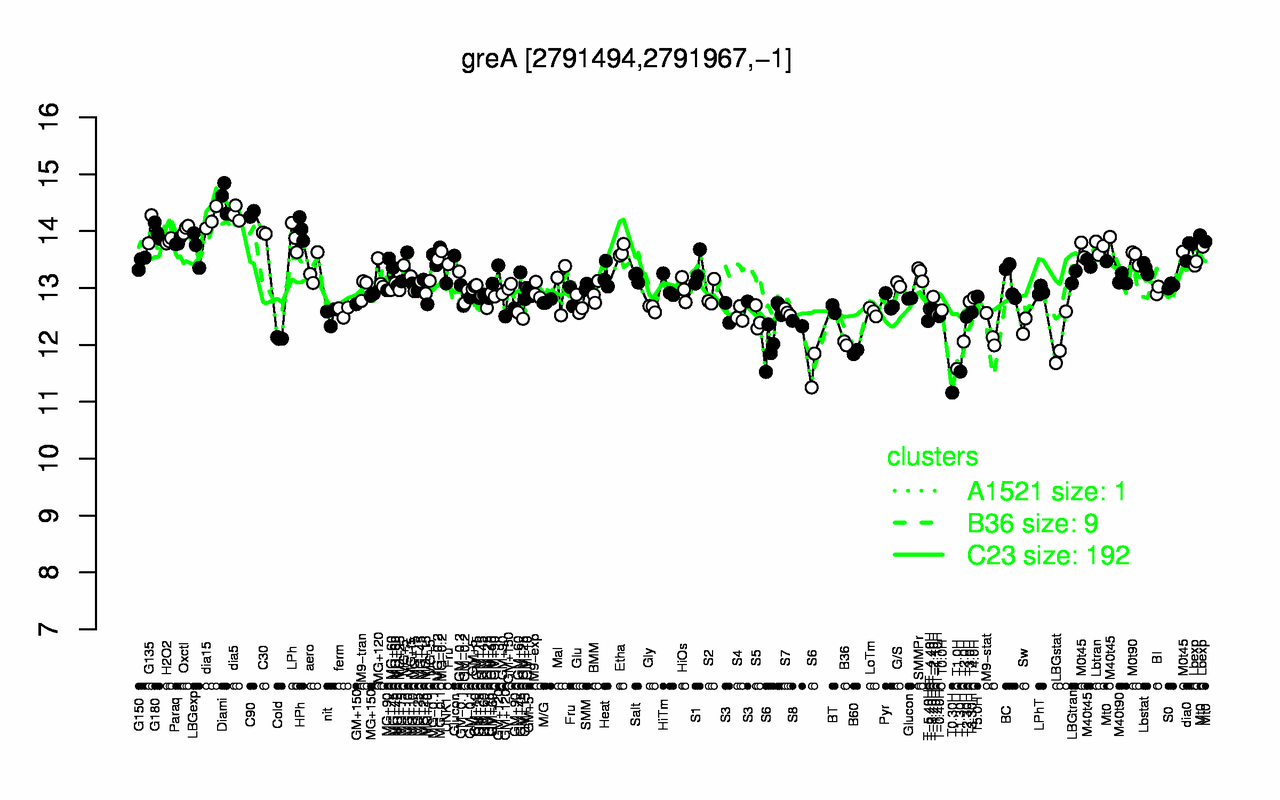
| Diami | dia5 | C90 | dia15 | Oxctl | HPh | G135 | G180 | C30 | LPh |
| 14.6 | 14.3 | 14.3 | 14.2 | 14 | 14 | 14 | 14 | 14 | 13.9 |
| T0.30H | T1.30H | T1.0H | B60 | B36 | LBGstat | T2.0H | S6 | Cold | M9-stat |
| 11.2 | 11.5 | 11.6 | 11.9 | 12 | 12.1 | 12.1 | 12.1 | 12.1 | 12.2 |