| Start Page |
|
 |
| Start Page |
|
|
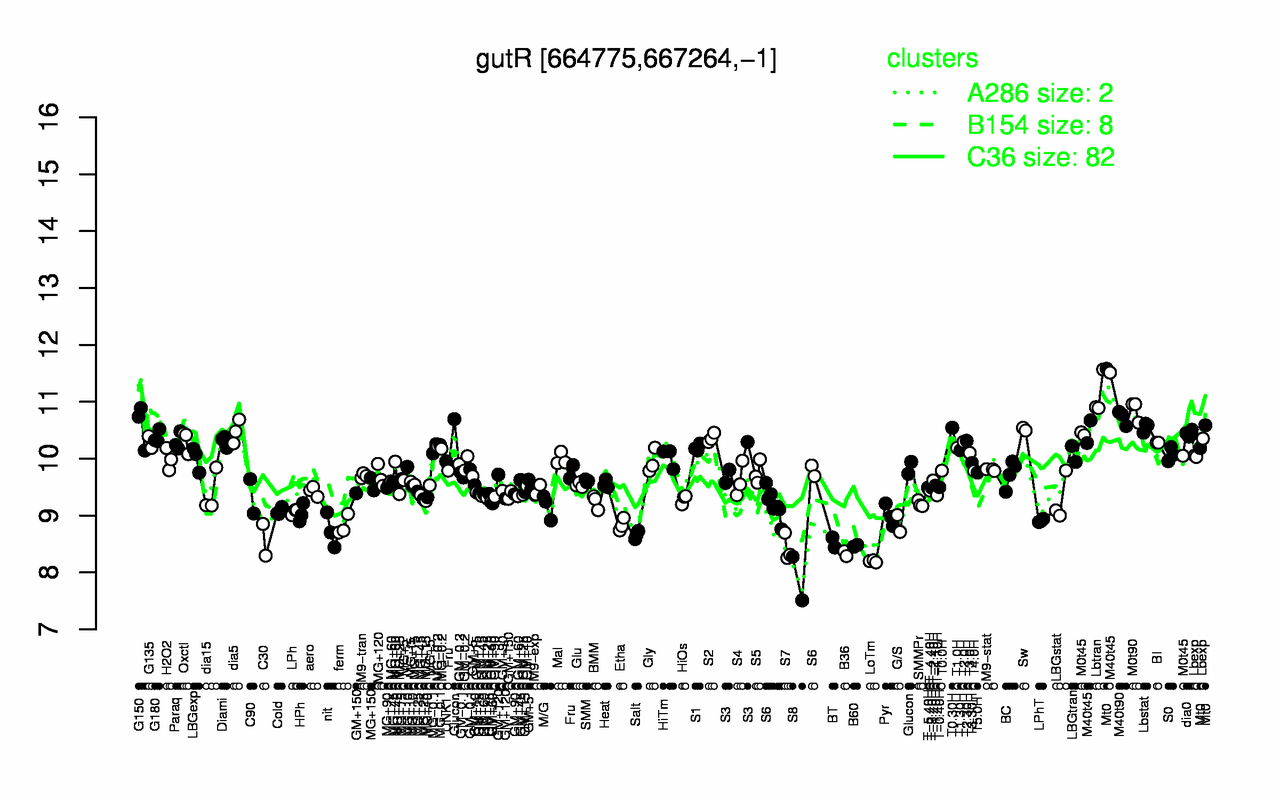
| Lbtran | M0t90 | M40t45 | Mt0 | M40t90 | G150 | Lbstat | T0.30H | Sw | dia5 |
| 11.1 | 10.8 | 10.8 | 10.8 | 10.7 | 10.6 | 10.6 | 10.5 | 10.5 | 10.5 |
| S8 | LoTm | B36 | S7 | B60 | BT | C30 | Salt | nit | ferm |
| 7.89 | 8.2 | 8.33 | 8.42 | 8.47 | 8.53 | 8.57 | 8.66 | 8.73 | 8.82 |