| Start Page |
|
 |
| Start Page |
|
|
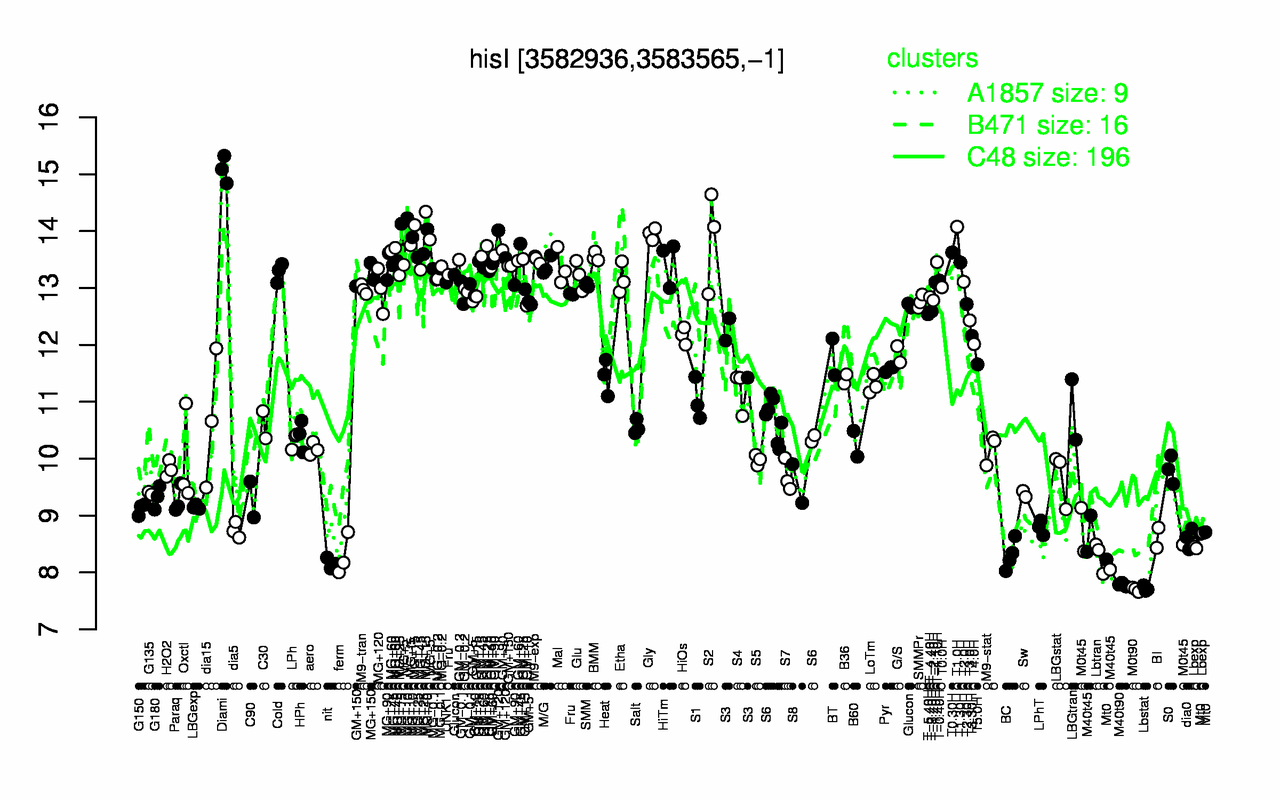
| Diami | MG+15 | T1.0H | MG+10 | Gly | S2 | GM+120 | MG+t5 | MG+60 | MG+5 |
| 15.1 | 14.2 | 14.1 | 14 | 14 | 13.9 | 13.8 | 13.8 | 13.7 | 13.6 |
| M0t90 | Lbstat | M40t90 | nit | Lbtran | ferm | BC | M40t45 | Lbexp | Mt0 |
| 7.7 | 7.72 | 7.79 | 8.16 | 8.29 | 8.29 | 8.31 | 8.47 | 8.52 | 8.54 |