B. subtilis Expression Data Browser
Start Page
B. subtilis Expression Data Browser
Gene/Segment:
iscU
Locus Tag:
BSU32680
Details about iscU
Show/Hide
Highest Expression Conditions
Sw
BI
C90
M40t45
T0.0H
H2O2
Lbtran
M0t45
Salt
BC
16.3
16.3
16.2
16.1
15.9
15.9
15.8
15.8
15.7
15.7
Lowest Expression Conditions
S6
ferm
S7
S8
nit
M9-stat
S5
BT
LBGstat
S2
13.7
13.9
13.9
14
14.1
14.2
14.2
14.3
14.3
14.4
Most Positively Correlated Segments
sufB
sufS
sufD
sufC
ahpF
ahpC
moeA
rsbU
rnjB
yfmR
0.97
0.95
0.94
0.84
0.77
0.75
0.74
0.74
0.73
0.73
Most Negatively Correlated Segments
yjzC
spoVAA
spoVAB
coxA
yozF
S700
spoVAEB
S701
spoVAEA
spoVAC
-0.7
-0.67
-0.67
-0.67
-0.67
-0.67
-0.67
-0.67
-0.66
-0.66
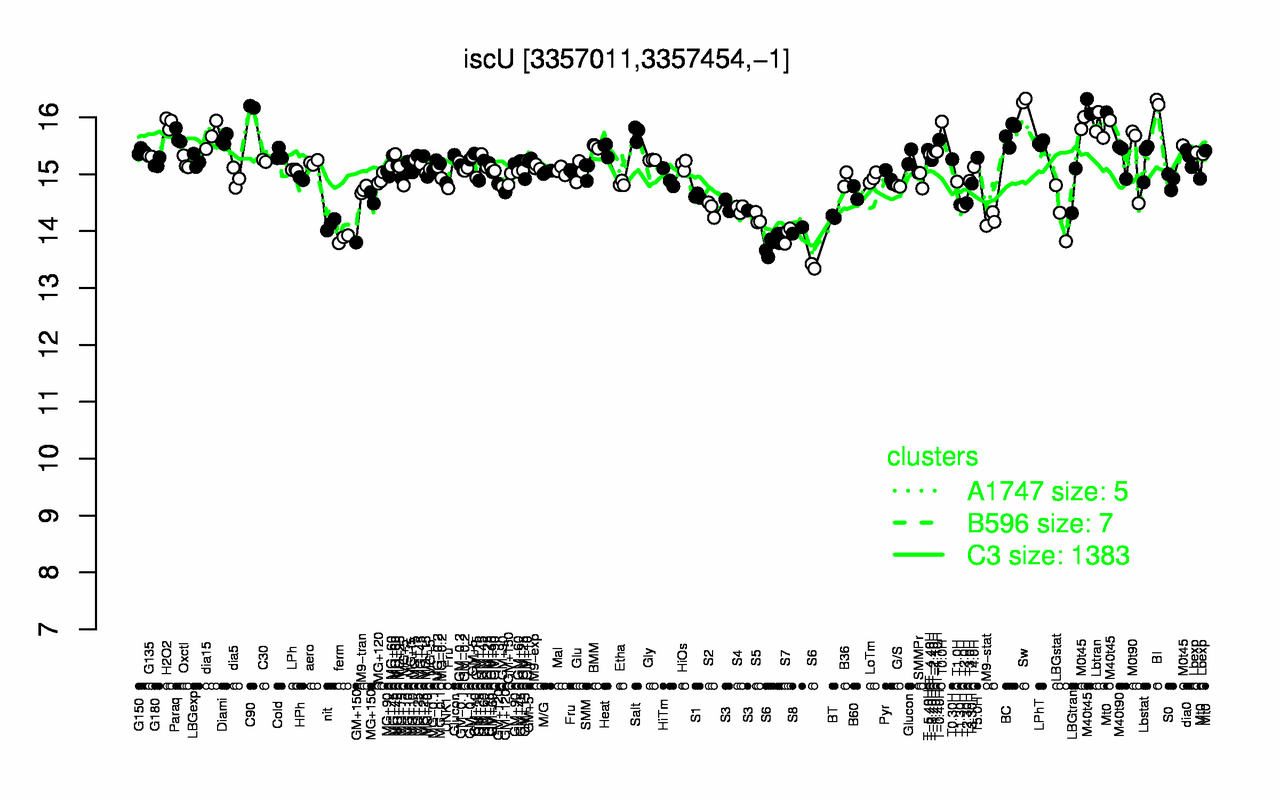
Expression Profile of Segment iscU
Show/Hide
Annotation of Gene iscU
Show/Hide
function
16.13: Shape
inference
ab initio prediction:AMIGene:2.0
codon_start
1
product
iron-sulfur cluster assembly scaffold protein
transl_table
11
note
Evidence 2b: Function of strongly homologous gene; PubMedId: 12682299, 16877383; Product type f : factor
db_xref
GI:2635764
protein_id
CAB15257.1
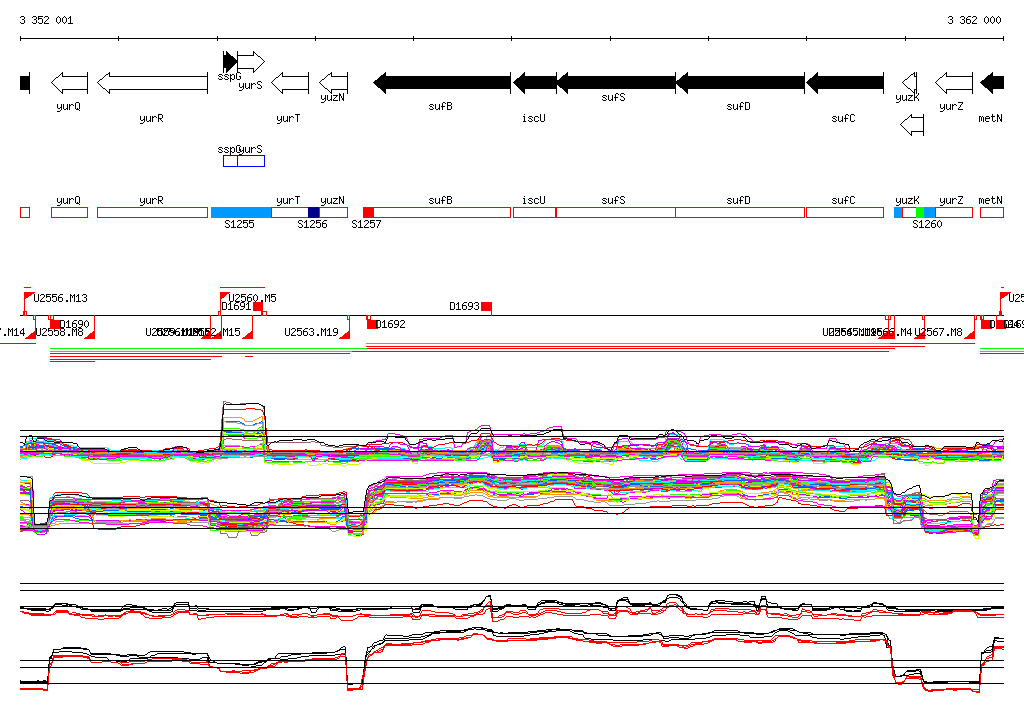
Genomic View of Gene/Segment iscU
Show/Hide
(Legend)
Browse Genome Context