| Start Page |
|
 |
| Start Page |
|
|
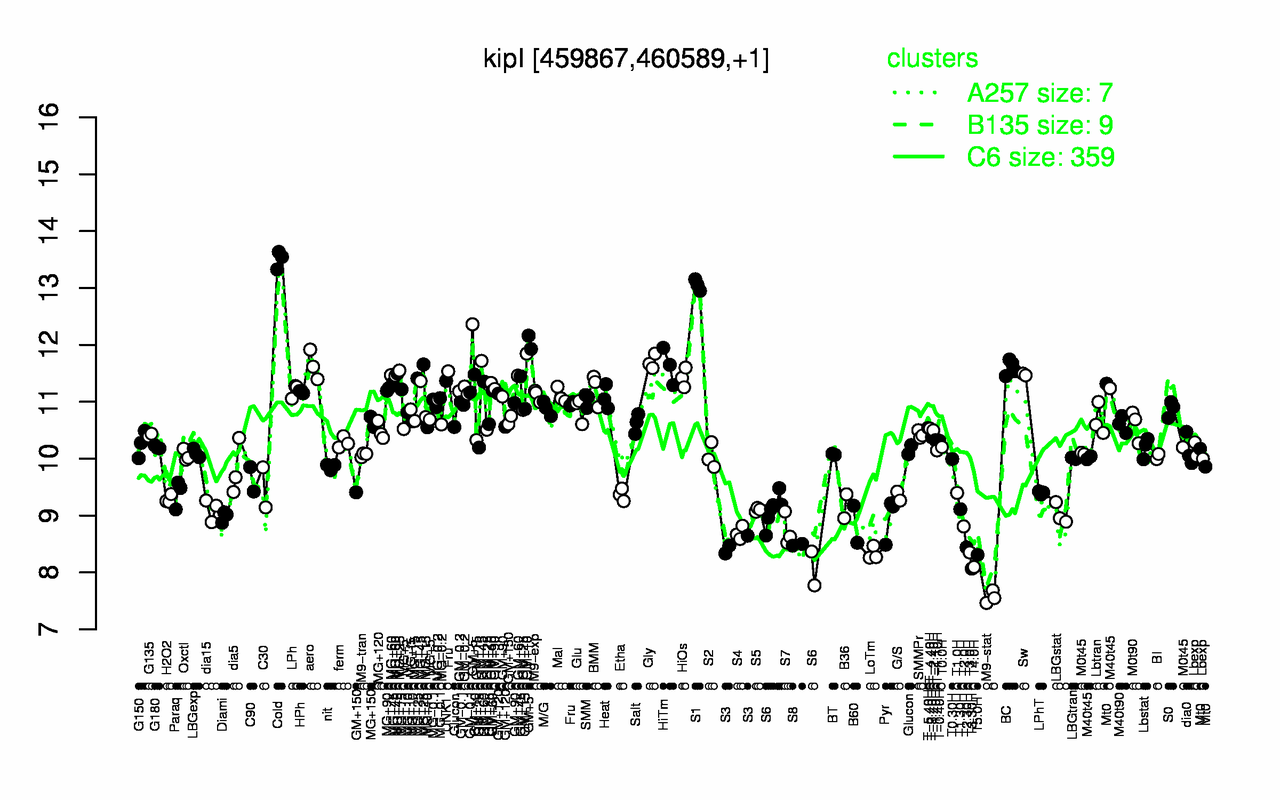
| Cold | S1 | GM+5 | Gly | GM+10 | aero | HiTm | BC | MG+25 | GM+45 |
| 13.5 | 13.1 | 12.2 | 11.7 | 11.7 | 11.6 | 11.6 | 11.6 | 11.5 | 11.5 |
| M9-stat | T3.30H | T4.0H | T5.0H | LoTm | T3.0H | T2.30H | S3 | S8 | S4 |
| 7.57 | 8.07 | 8.1 | 8.31 | 8.33 | 8.35 | 8.44 | 8.49 | 8.49 | 8.69 |