| Start Page |
|
 |
| Start Page |
|
|
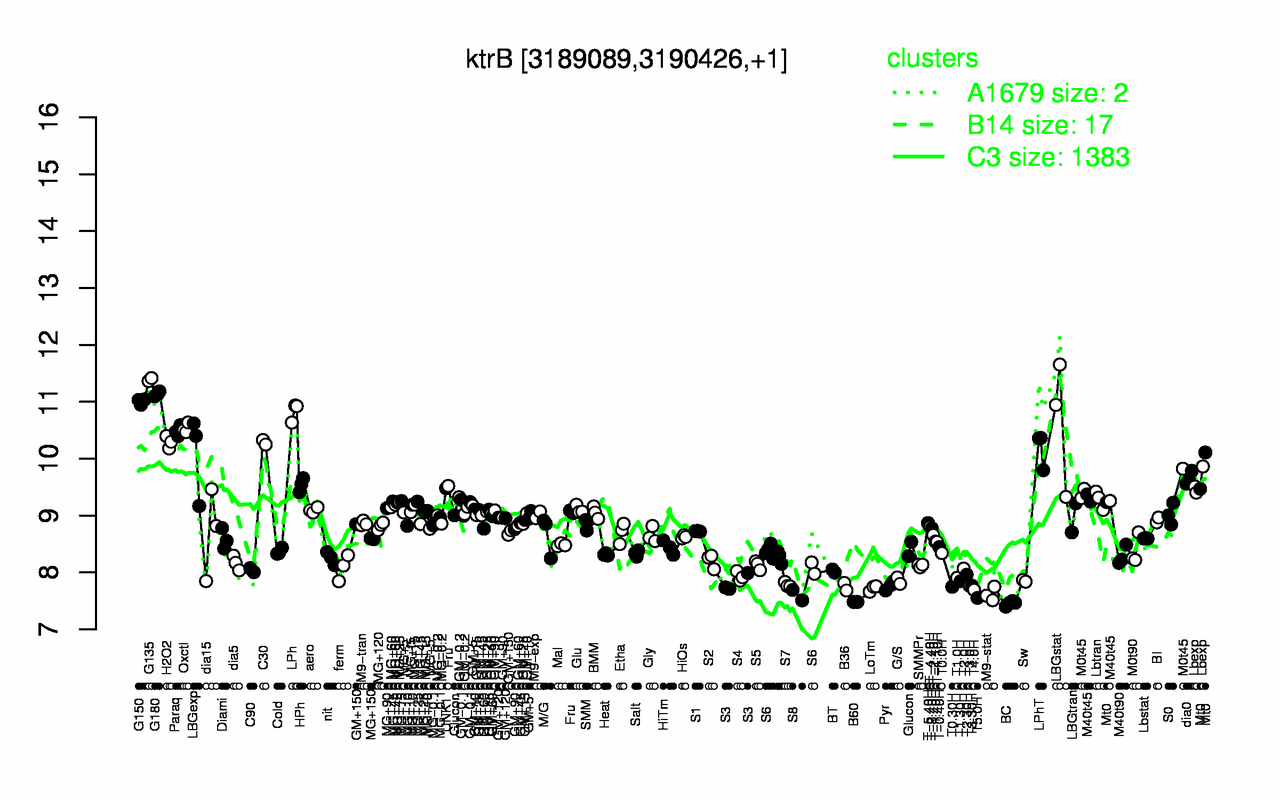
| G135 | G180 | G150 | LPh | LBGstat | Oxctl | Paraq | H2O2 | C30 | LPhT |
| 11.4 | 11.1 | 11 | 10.8 | 10.6 | 10.5 | 10.5 | 10.3 | 10.3 | 10.2 |
| BC | B60 | T5.0H | S8 | M9-stat | T4.0H | LoTm | T0.30H | B36 | T3.30H |
| 7.46 | 7.48 | 7.55 | 7.6 | 7.62 | 7.7 | 7.72 | 7.75 | 7.75 | 7.76 |