| Start Page |
|
 |
| Start Page |
|
|
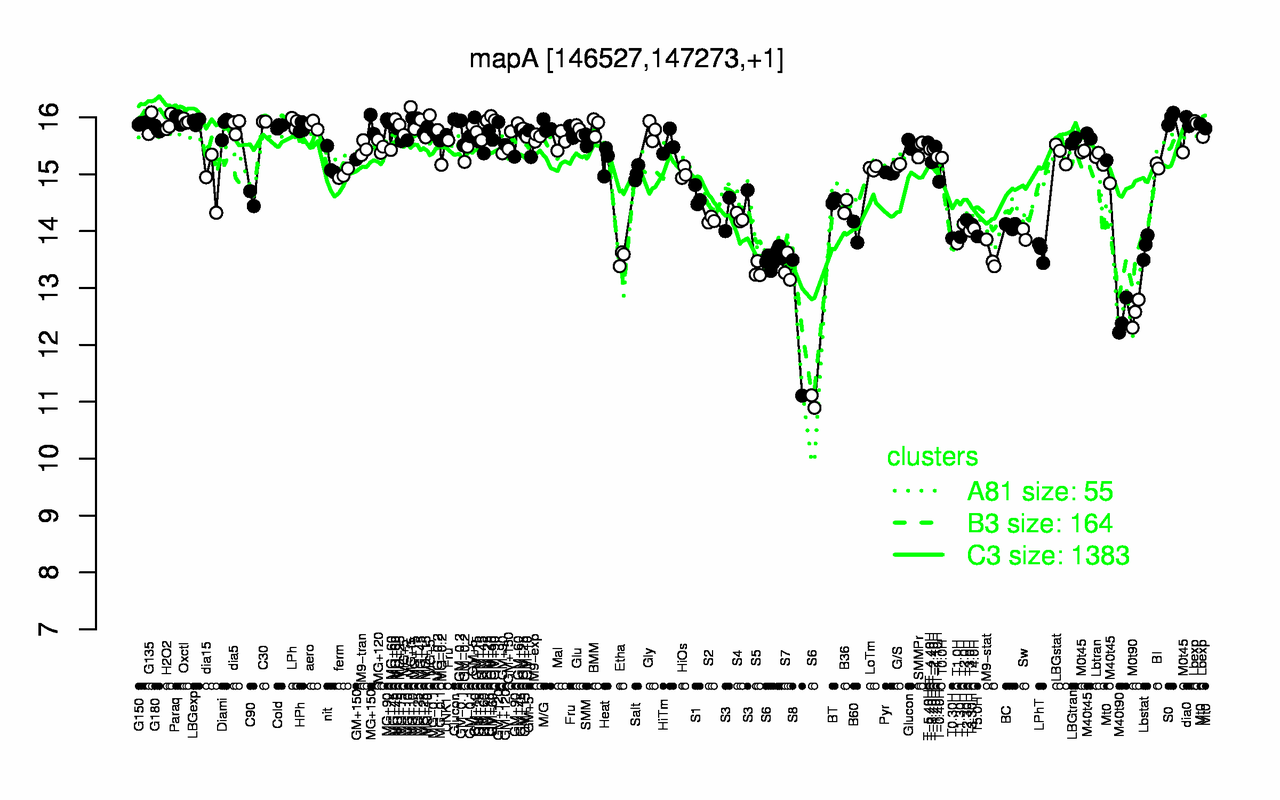
| MG+t5 | S0 | Paraq | MG+90 | Oxctl | dia0 | C30 | LBGexp | LPh | H2O2 |
| 16.2 | 16 | 16 | 15.9 | 15.9 | 15.9 | 15.9 | 15.9 | 15.9 | 15.9 |
| S8 | M40t90 | M0t90 | S6 | S5 | S7 | Etha | M9-stat | LPhT | Lbstat |
| 12.3 | 12.5 | 12.6 | 13 | 13.3 | 13.3 | 13.5 | 13.6 | 13.6 | 13.7 |