| Start Page |
|
 |
| Start Page |
|
|
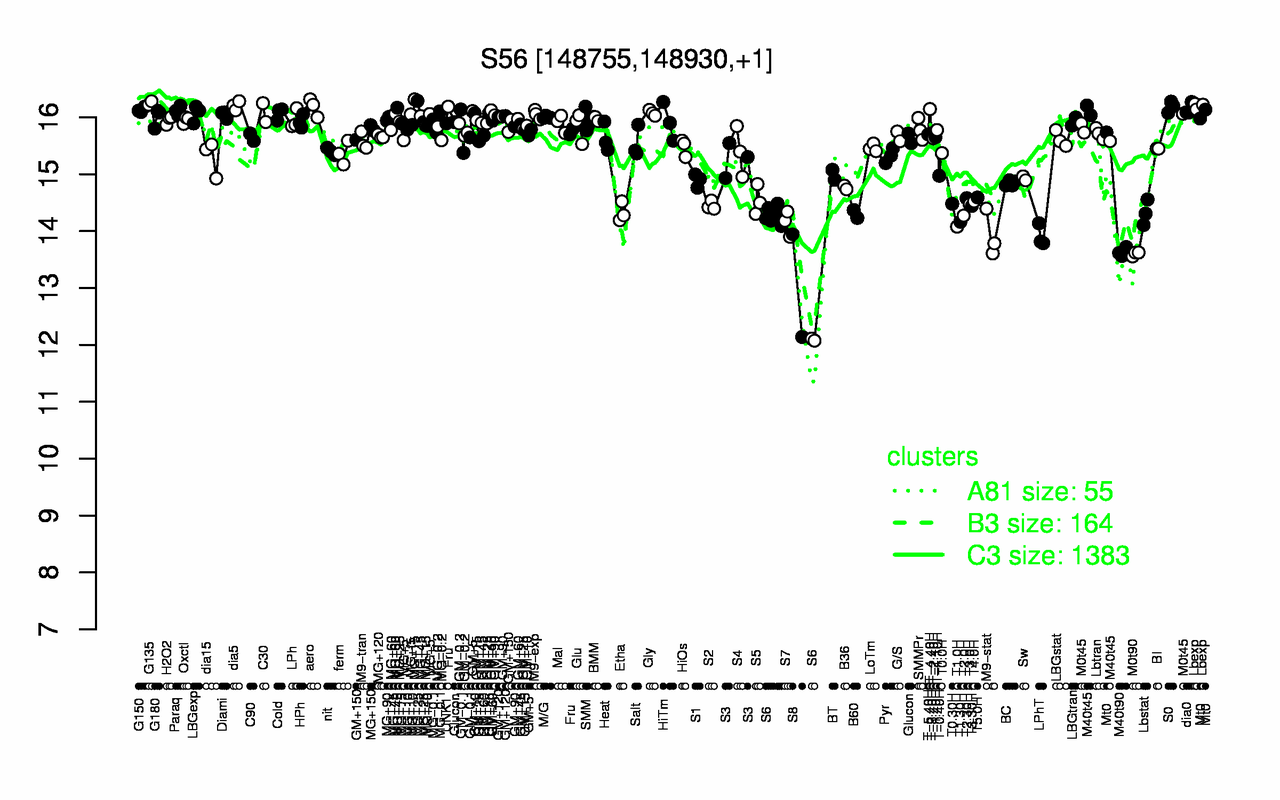
| G135 | dia5 | Lbexp | S0 | aero | dia0 | T-4.40H | G150 | Paraq | C30 |
| 16.3 | 16.2 | 16.2 | 16.2 | 16.2 | 16.1 | 16.1 | 16.1 | 16.1 | 16.1 |
| S8 | M0t90 | M40t90 | S6 | LPhT | M9-stat | T1.0H | S7 | T1.30H | T2.0H |
| 13 | 13.6 | 13.6 | 13.8 | 13.9 | 13.9 | 14.1 | 14.1 | 14.2 | 14.3 |