| Start Page |
|
 |
| Start Page |
|
|
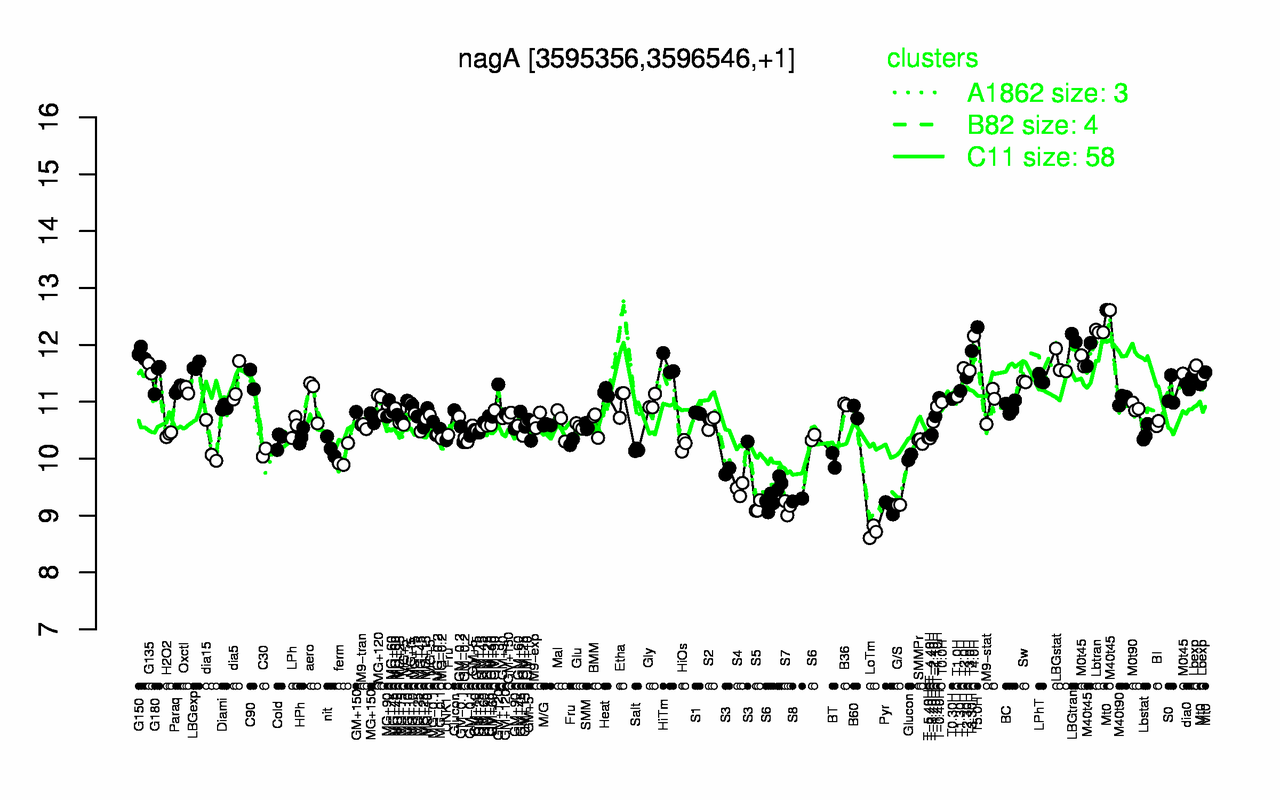
| T5.0H | Lbtran | T4.0H | LBGtran | M40t45 | T3.30H | G150 | Mt0 | LBGstat | M0t45 |
| 12.3 | 12.2 | 12.2 | 12.1 | 12.1 | 11.9 | 11.9 | 11.8 | 11.7 | 11.6 |
| LoTm | S7 | S5 | Pyr | G/S | S8 | S4 | S6 | S3 | BT |
| 8.72 | 9.14 | 9.15 | 9.15 | 9.19 | 9.27 | 9.46 | 9.6 | 9.95 | 9.97 |