B. subtilis Expression Data Browser
Start Page
B. subtilis Expression Data Browser
Gene/Segment:
phoA
Locus Tag:
BSU09410
Details about phoA
Show/Hide
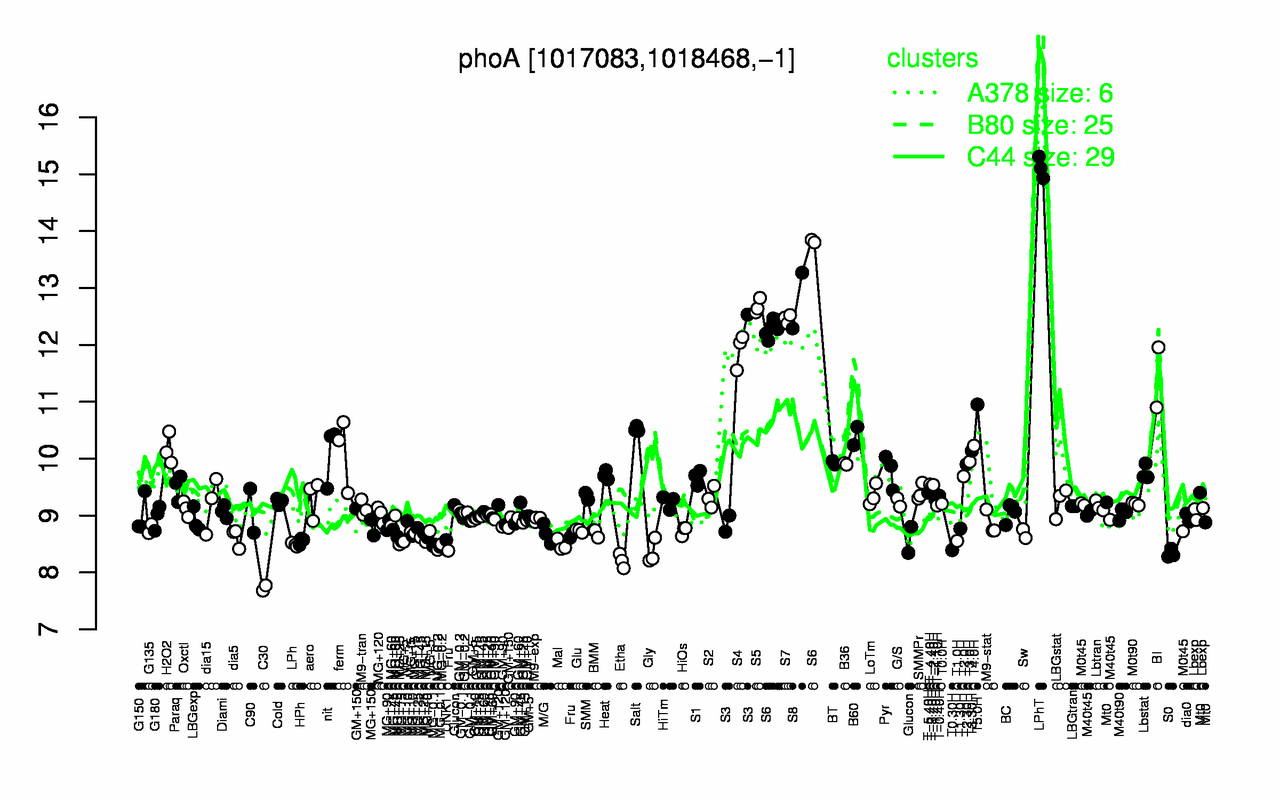
Highest Expression Conditions
LPhT
S8
S5
S6
S7
S4
BI
T5.0H
Salt
B60
15.1
12.8
12.7
12.6
12.5
11.9
11.4
11
10.5
10.4
Lowest Expression Conditions
C30
Etha
S0
Gly
T0.30H
MG-0.2
MG-0.1
Mal
LPh
HPh
7.73
8.2
8.33
8.35
8.39
8.45
8.47
8.48
8.49
8.55
Most Positively Correlated Segments
ydhF
phoB
tuaG
tuaF
yugS
tuaH
yycP
yycO
sspC
gerBA
0.85
0.85
0.81
0.81
0.8
0.8
0.8
0.78
0.78
0.76
Most Negatively Correlated Segments
yviA
accB
accC
parA
upp
yabJ
yvbX
yeaC
ytnA
asnB
-0.72
-0.72
-0.71
-0.69
-0.69
-0.69
-0.69
-0.69
-0.68
-0.68
Expression Profile of Segment phoA
Show/Hide
Annotation of Gene phoA
Show/Hide
function
16.11: Scavenge (Catabolism)
inference
ab initio prediction:AMIGene:2.0
codon_start
1
EC_number
3.1.3.1
transl_table
11
note
Evidence 1a: Function experimentally demonstrated in the studied strain; PubMedId: 10913081, 12897025, 8830275; Product type e: enzyme
db_xref
GI:225184848
product
alkaline phosphatase A
protein_id
CAB12780.2
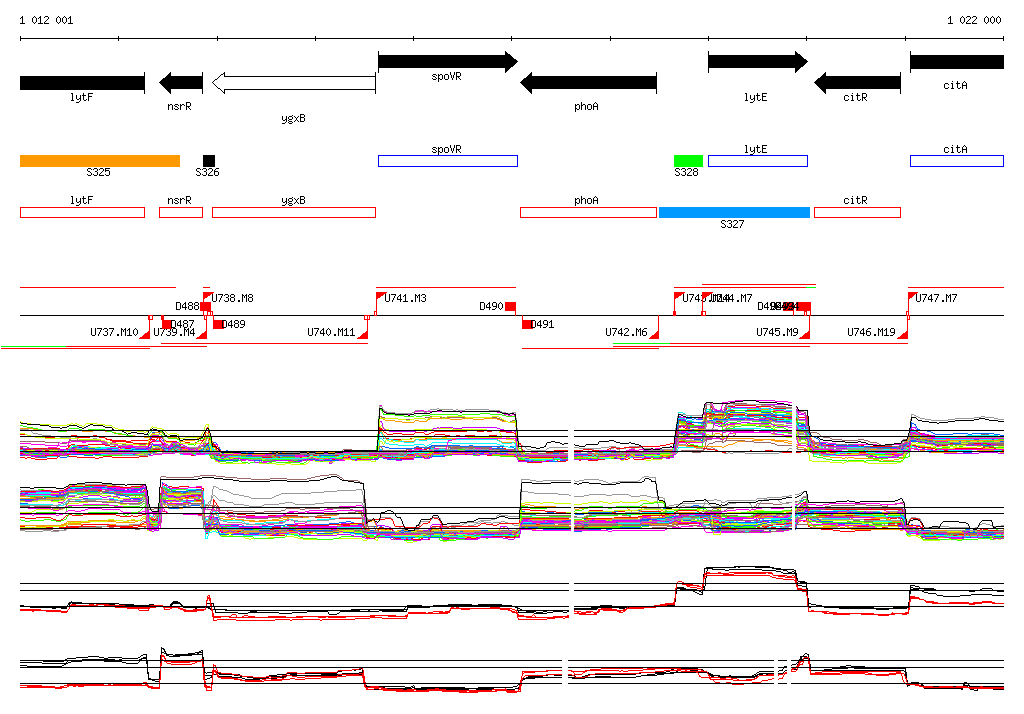
Genomic View of Gene/Segment phoA
Show/Hide
(Legend)
Browse Genome Context