B. subtilis Expression Data Browser
Start Page
B. subtilis Expression Data Browser
Gene/Segment:
tuaG
Locus Tag:
BSU35550
Details about tuaG
Show/Hide
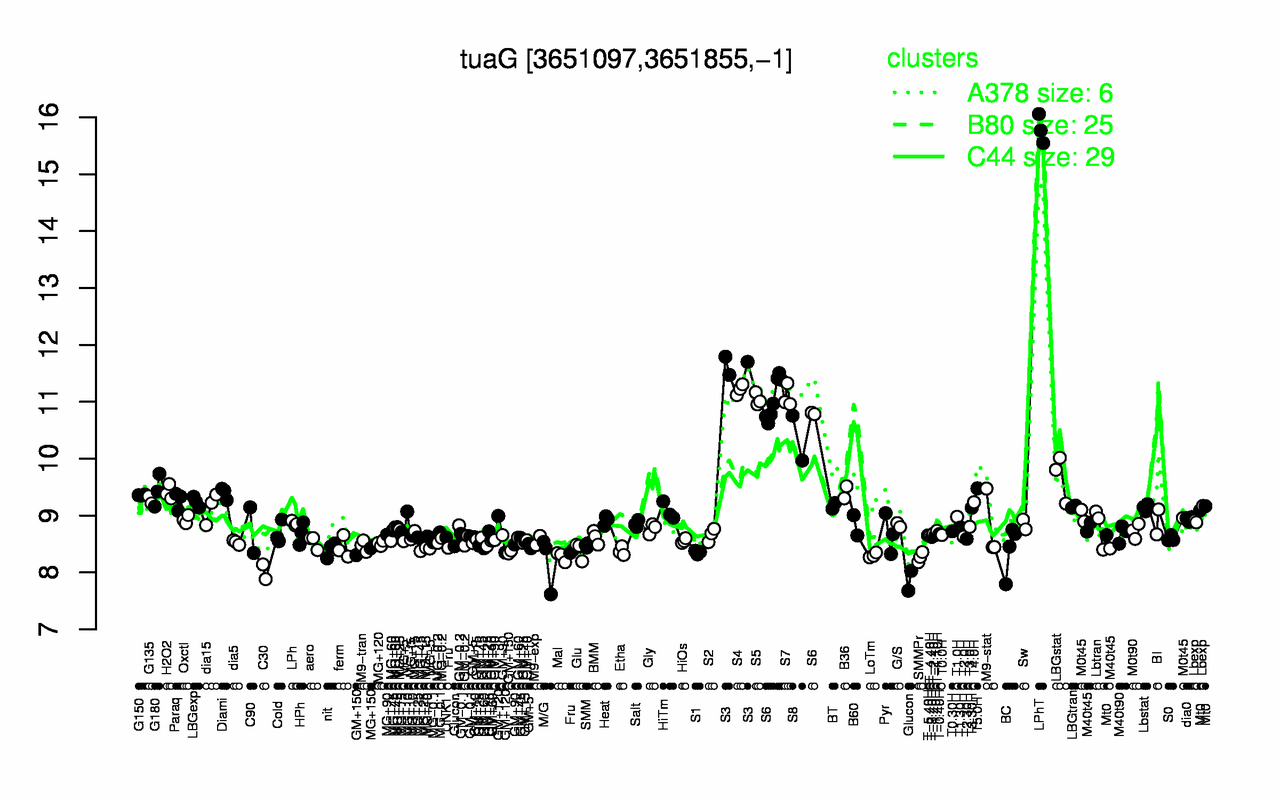
Highest Expression Conditions
LPhT
S3
S4
S7
S5
S6
S8
LBGstat
T5.0H
G180
15.8
11.7
11.2
11.1
11
11
10.4
9.68
9.48
9.44
Lowest Expression Conditions
C30
Glucon
M/G
SMMPr
Mal
LoTm
GM+150
S1
Etha
Glu
8.01
8.06
8.19
8.27
8.28
8.3
8.34
8.35
8.38
8.38
Most Positively Correlated Segments
tuaH
tuaF
S1361
tuaD
ydhF
tuaC
tuaE
phoB
phoA
tuaB
0.99
0.98
0.91
0.9
0.86
0.85
0.84
0.82
0.81
0.75
Most Negatively Correlated Segments
wprA
accC
ydjH
ydjI
accB
ydjG
S221
glnA
fabG
pspA
-0.65
-0.64
-0.6
-0.6
-0.6
-0.6
-0.6
-0.59
-0.58
-0.58
Expression Profile of Segment tuaG
Show/Hide
Annotation of Gene tuaG
Show/Hide
function
16.8: Protect
function
16.13: Shape
inference
ab initio prediction:AMIGene:2.0
codon_start
1
EC_number
2.4.1.-
transl_table
11
note
Evidence 3: Function proposed based on presence of conserved amino acid motif, structural feature or limited homology; PubMedId: 10048024, 11994144, 4975313; Product type pe: putative enzyme
db_xref
GI:2636081
product
putative glycosyltransferase
protein_id
CAB15572.1
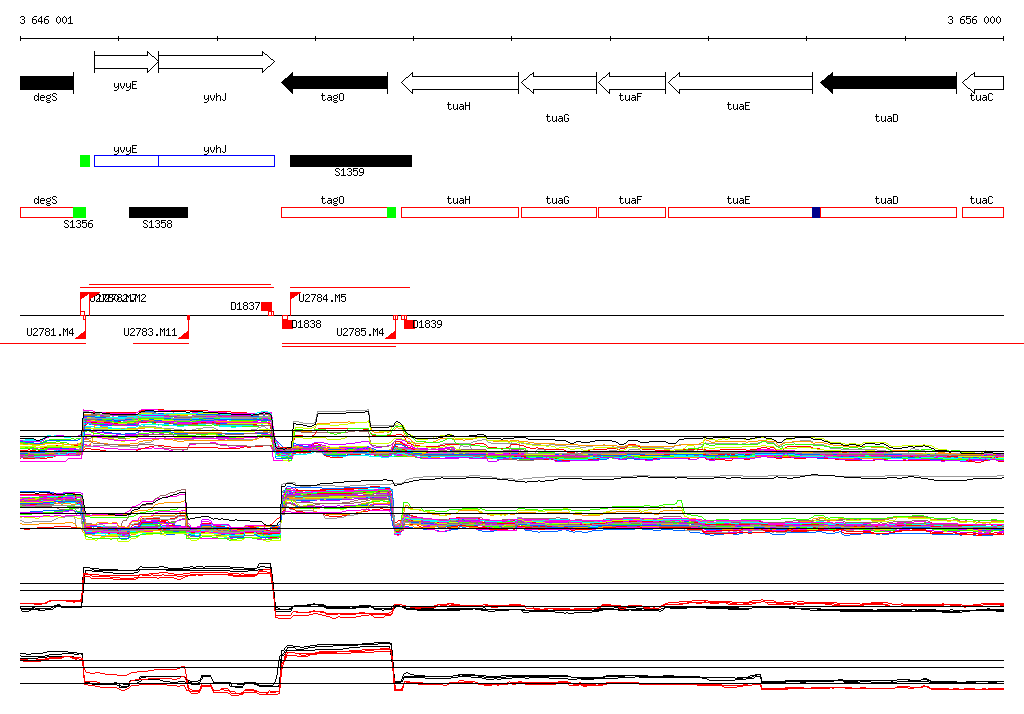
Genomic View of Gene/Segment tuaG
Show/Hide
(Legend)
Browse Genome Context