B. subtilis Expression Data Browser
Start Page
B. subtilis Expression Data Browser
Gene/Segment:
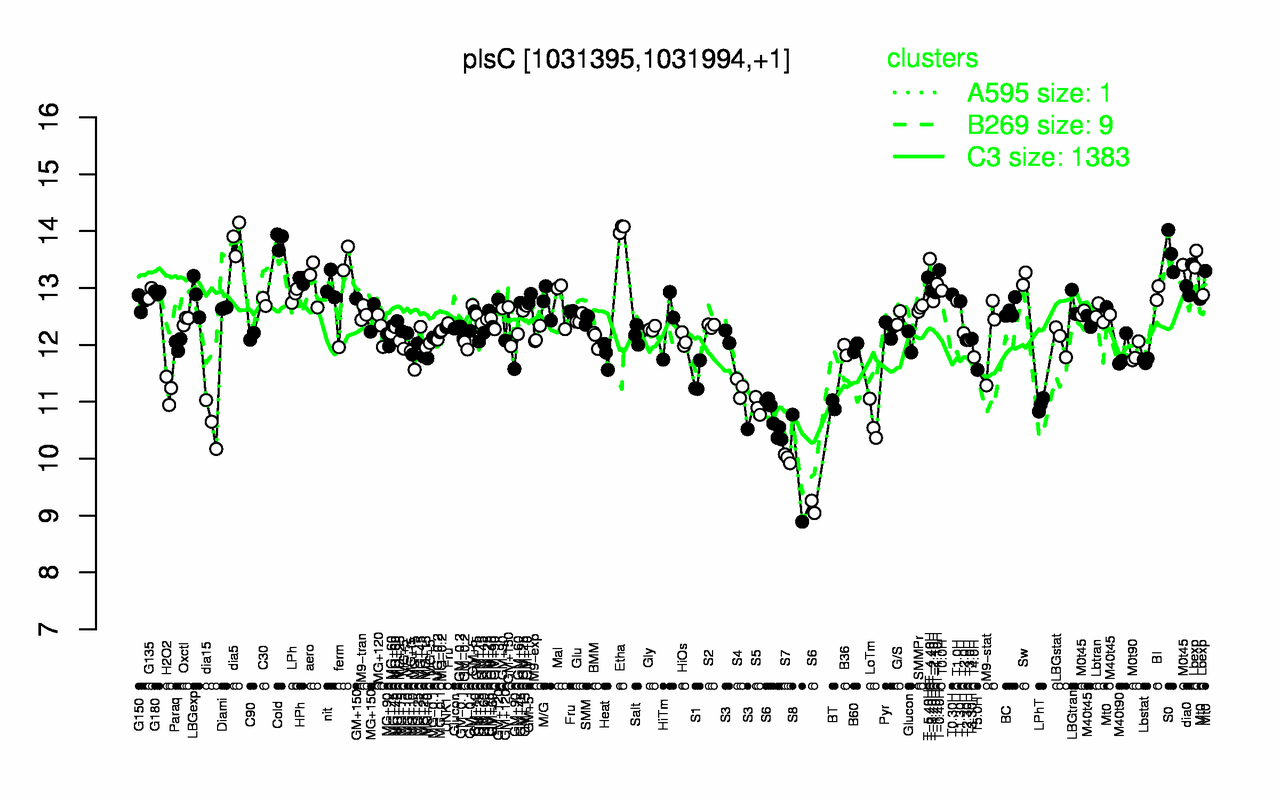
plsC
Locus Tag:
BSU09540
Details about plsC
Show/Hide
Highest Expression Conditions
Etha
dia5
Cold
S0
T-4.40H
T-0.40H
Lbexp
T-5.40H
Sw
HPh
14
13.9
13.8
13.6
13.5
13.3
13.3
13.2
13.2
13.1
Lowest Expression Conditions
S8
S7
S6
dia15
LoTm
S5
BT
LPhT
H2O2
S4
9.83
10
10.4
10.6
10.7
10.9
10.9
10.9
11.2
11.2
Most Positively Correlated Segments
fabI
fapR
plsX
secA
fabD
fabG
asnS
S847
accC
S1348
0.77
0.75
0.74
0.7
0.7
0.69
0.66
0.66
0.66
0.65
Most Negatively Correlated Segments
yycP
yycO
yozP
S562
nucB
S803
yozE
yisY
S393
S699
-0.7
-0.69
-0.68
-0.68
-0.67
-0.67
-0.67
-0.67
-0.66
-0.66
Expression Profile of Segment plsC
Show/Hide
Annotation of Gene plsC
Show/Hide
function
16.13: Shape
function
16.2: Construct biomass (Anabolism)
inference
ab initio prediction:AMIGene:2.0
codon_start
1
EC_number
2.3.1.51
transl_table
11
note
Evidence 1a: Function experimentally demonstrated in the studied strain; PubMedId: 12682299, 1557036, 17557823; Product type e: enzyme
db_xref
GI:2633289
product
1-acylglycerol-phosphate (1-acyl-G3P) acyltransferase
protein_id
CAB12793.1
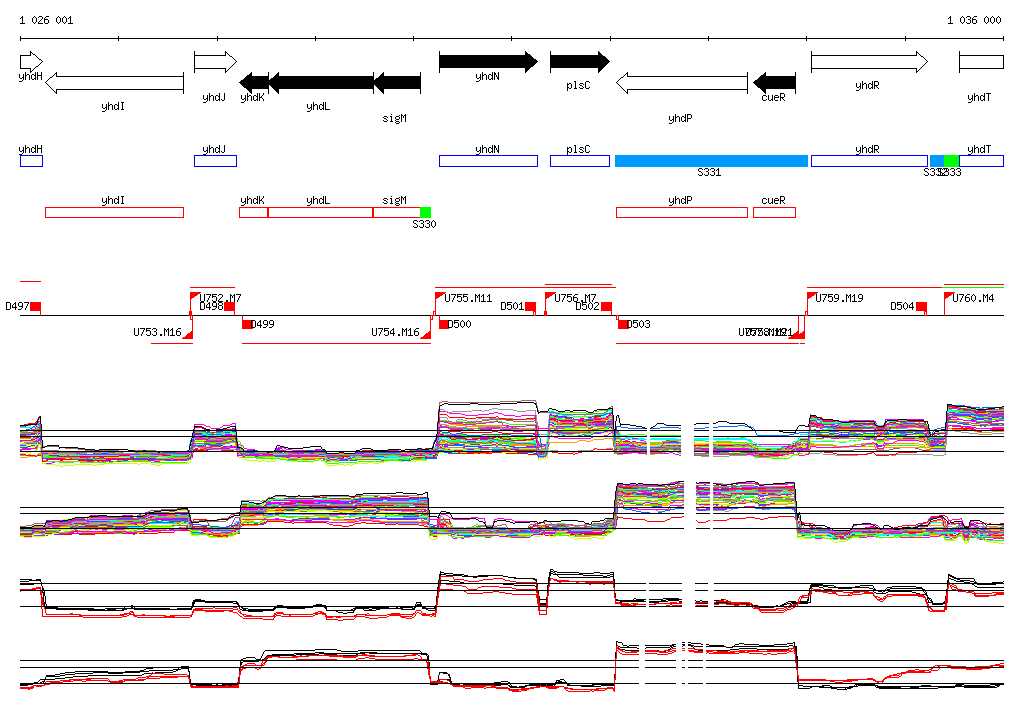
Genomic View of Gene/Segment plsC
Show/Hide
(Legend)
Browse Genome Context