| Start Page |
|
 |
| Start Page |
|
|
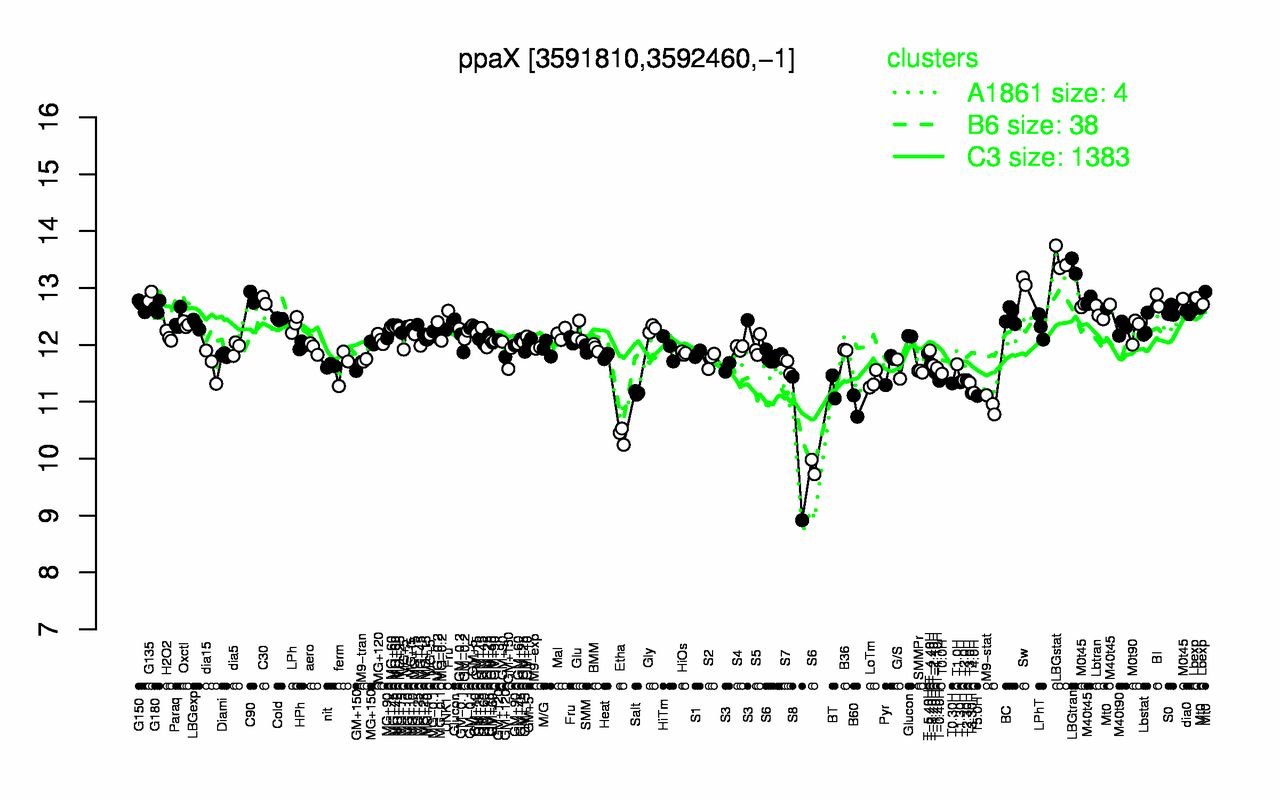
| LBGstat | LBGtran | Sw | G135 | C90 | Lbexp | C30 | BI | M40t45 | Mt0 |
| 13.5 | 13.4 | 13.1 | 12.9 | 12.8 | 12.8 | 12.8 | 12.8 | 12.8 | 12.7 |
| S8 | Etha | B60 | M9-stat | T5.0H | T3.30H | Salt | T4.0H | BT | T0.30H |
| 10.2 | 10.4 | 10.9 | 11 | 11.1 | 11.2 | 11.2 | 11.2 | 11.3 | 11.3 |