| Start Page |
|
 |
| Start Page |
|
|
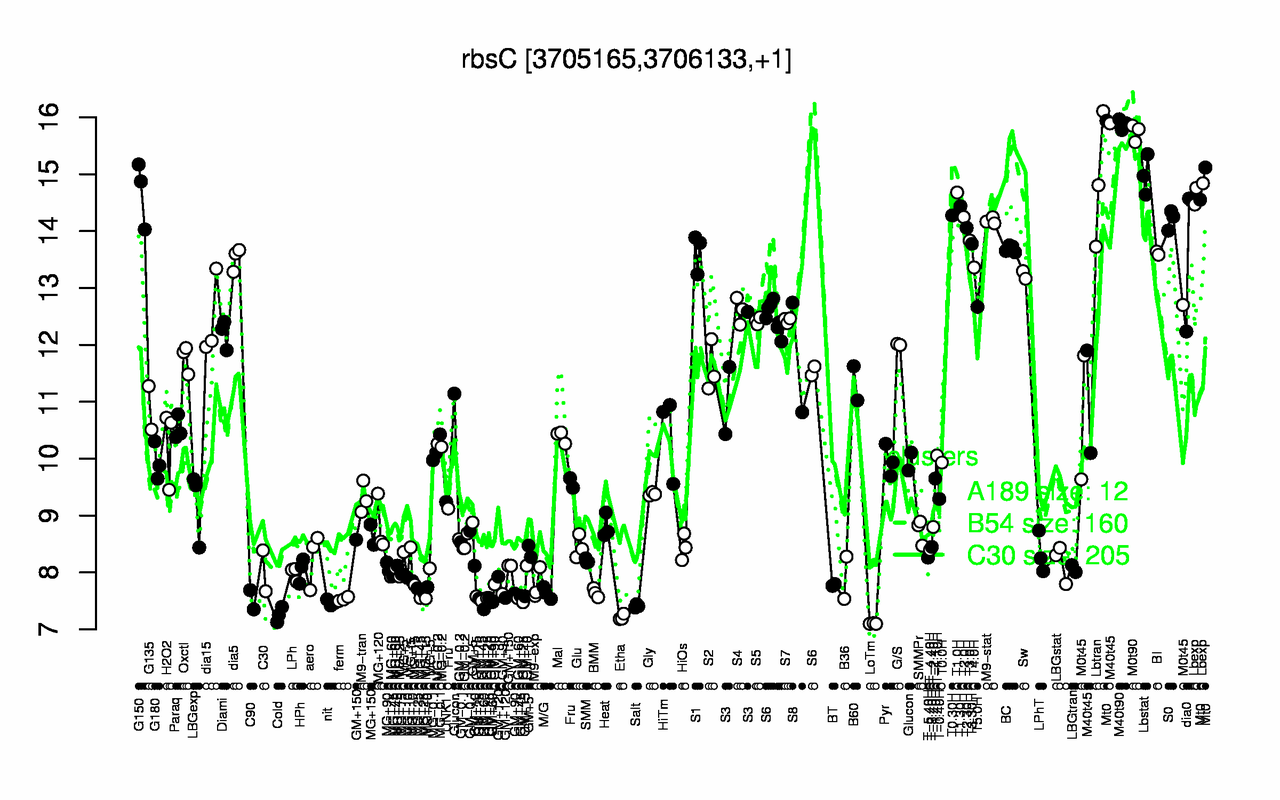
| M40t90 | M0t90 | Mt0 | Lbstat | Lbtran | G150 | Lbexp | T1.0H | T1.30H | T0.30H |
| 15.9 | 15.7 | 15.2 | 15 | 14.9 | 14.7 | 14.7 | 14.7 | 14.4 | 14.3 |
| LoTm | Etha | Cold | Salt | GM+60 | nit | C90 | GM+45 | GM+25 | ferm |
| 7.1 | 7.21 | 7.26 | 7.41 | 7.46 | 7.47 | 7.52 | 7.52 | 7.52 | 7.53 |