| Start Page |
|
 |
| Start Page |
|
|
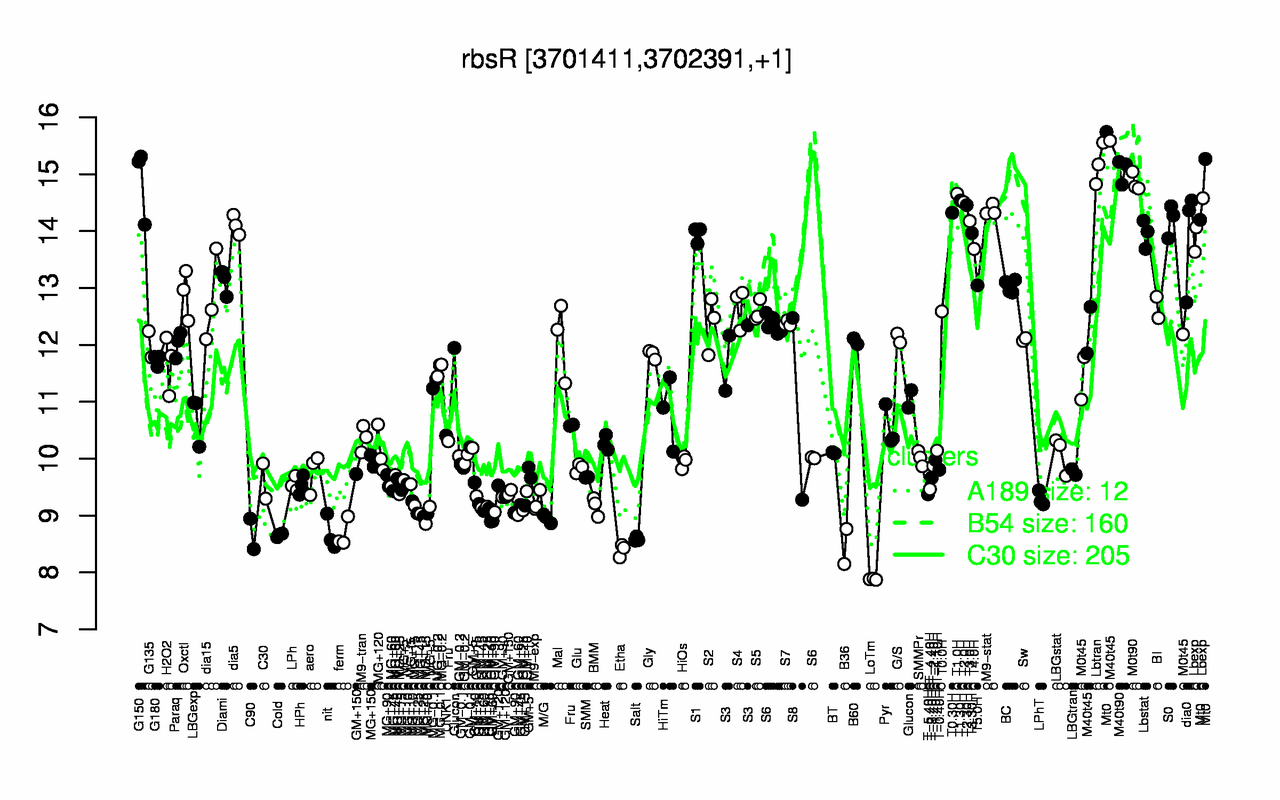
| Lbtran | Mt0 | M40t90 | G150 | M0t90 | T1.0H | T1.30H | T2.0H | T2.30H | M9-stat |
| 15.2 | 15.1 | 15.1 | 14.9 | 14.9 | 14.7 | 14.5 | 14.5 | 14.5 | 14.4 |
| LoTm | Etha | B36 | Salt | Cold | C90 | nit | ferm | M/G | GM+60 |
| 7.88 | 8.39 | 8.46 | 8.59 | 8.65 | 8.68 | 8.68 | 8.68 | 8.95 | 9 |