B. subtilis Expression Data Browser
Start Page
B. subtilis Expression Data Browser
Gene/Segment:
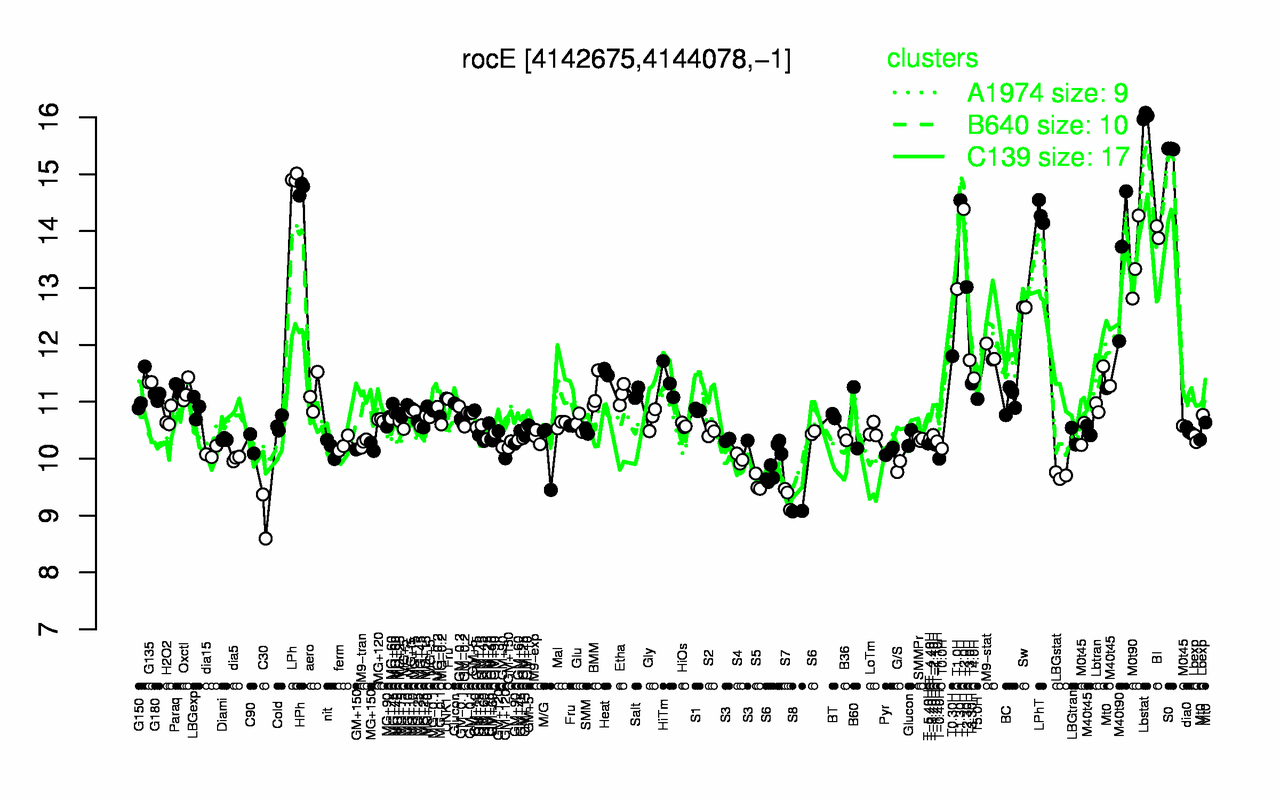
rocE
Locus Tag:
BSU40330
Details about rocE
Show/Hide
Highest Expression Conditions
Lbstat
S0
LPh
HPh
T1.30H
T2.0H
LPhT
BI
M40t90
M0t90
16
15.4
14.9
14.7
14.5
14.4
14.3
14
13.5
13.5
Lowest Expression Conditions
C30
S8
S7
S5
LBGstat
G/S
S4
T-0.40H
dia5
S6
8.98
9.08
9.33
9.57
9.7
9.86
9.99
10
10
10
Most Positively Correlated Segments
argI
S1551
rocD
rocA
rocB
S1461
rocG
rocC
S1460
gutB
0.98
0.96
0.93
0.91
0.88
0.78
0.77
0.77
0.76
0.55
Most Negatively Correlated Segments
artR
artQ
ytzD
proH
S909
proJ
artP
S514
yjnA
yuiC
-0.49
-0.48
-0.48
-0.46
-0.45
-0.45
-0.44
-0.43
-0.42
-0.42
Expression Profile of Segment rocE
Show/Hide
Annotation of Gene rocE
Show/Hide
function
16.1: Circulate
inference
ab initio prediction:AMIGene:2.0
codon_start
1
product
arginine/ornithine/gamma-aminobutyrate permease
transl_table
11
note
Evidence 1a: Function experimentally demonstrated in the studied strain; PubMedId: 10648515, 15849754, 16850406, 7540694; Product type t: transporter
db_xref
GI:2636580
protein_id
CAB16070.1
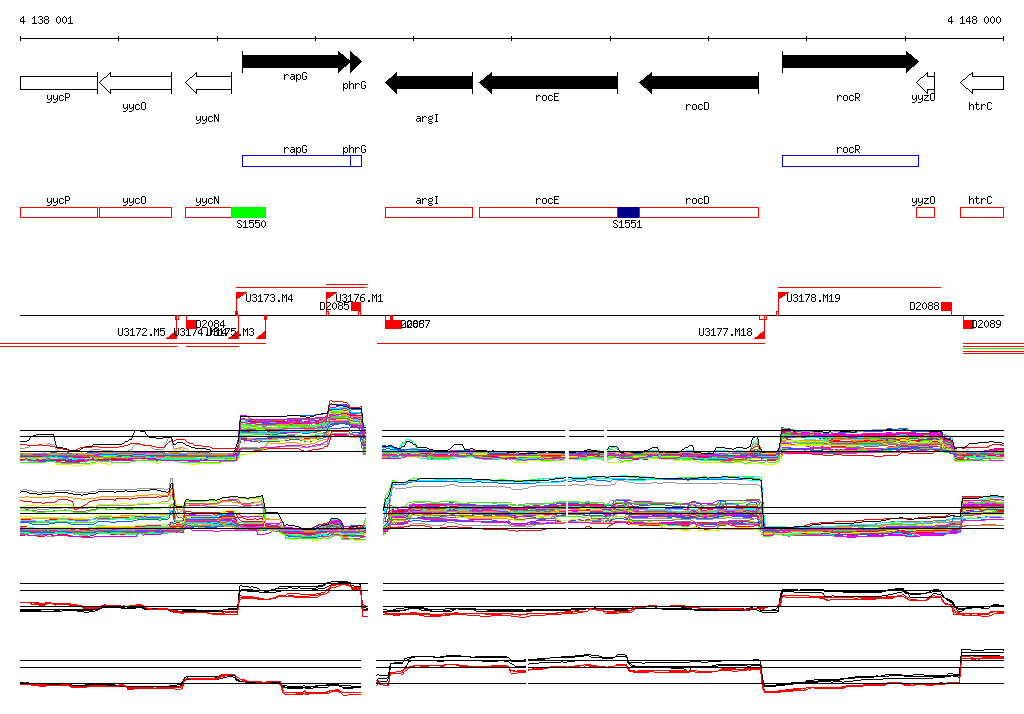
Genomic View of Gene/Segment rocE
Show/Hide
(Legend)
Browse Genome Context