B. subtilis Expression Data Browser
Start Page
B. subtilis Expression Data Browser
Gene/Segment:
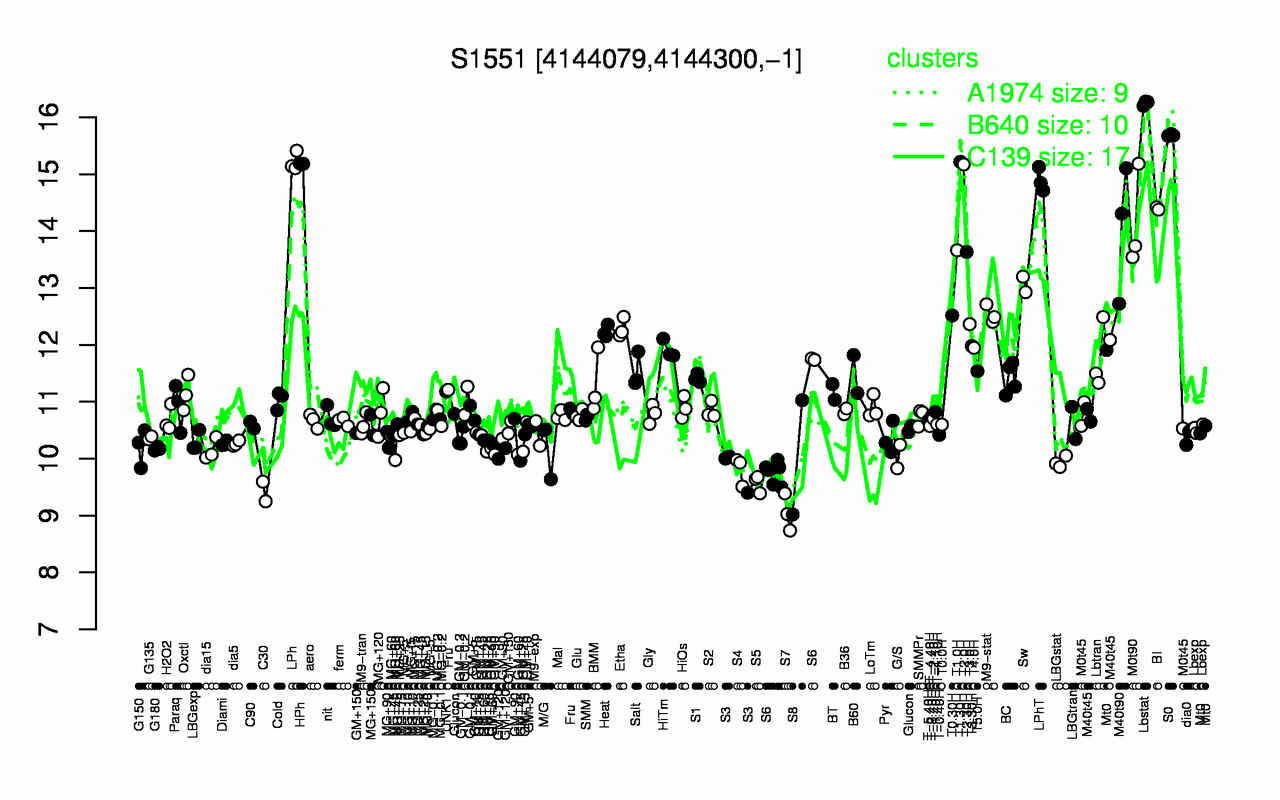
S1551
Locus Tag:
new_4144079_4144300_c
Details about S1551
Show/Hide
Highest Expression Conditions
Lbstat
S0
LPh
T1.30H
HPh
T2.0H
LPhT
BI
M0t90
M40t90
16.2
15.7
15.2
15.2
15.2
15.2
14.9
14.4
14.2
14
Lowest Expression Conditions
S7
C30
S5
S4
S3
LBGstat
S8
G/S
GM+120
dia15
9.05
9.42
9.57
9.8
9.81
9.94
10
10
10.1
10.2
Most Positively Correlated Segments
rocD
rocE
argI
rocB
rocA
S1461
rocC
rocG
S1460
ymcA
0.98
0.96
0.92
0.89
0.89
0.79
0.78
0.77
0.77
0.55
Most Negatively Correlated Segments
artR
ytzD
NA
artQ
lmrA
S514
S513
lysP
ptsG
mbl
-0.5
-0.5
-0.49
-0.49
-0.49
-0.47
-0.46
-0.46
-0.46
-0.46
Expression Profile of Segment S1551
Show/Hide
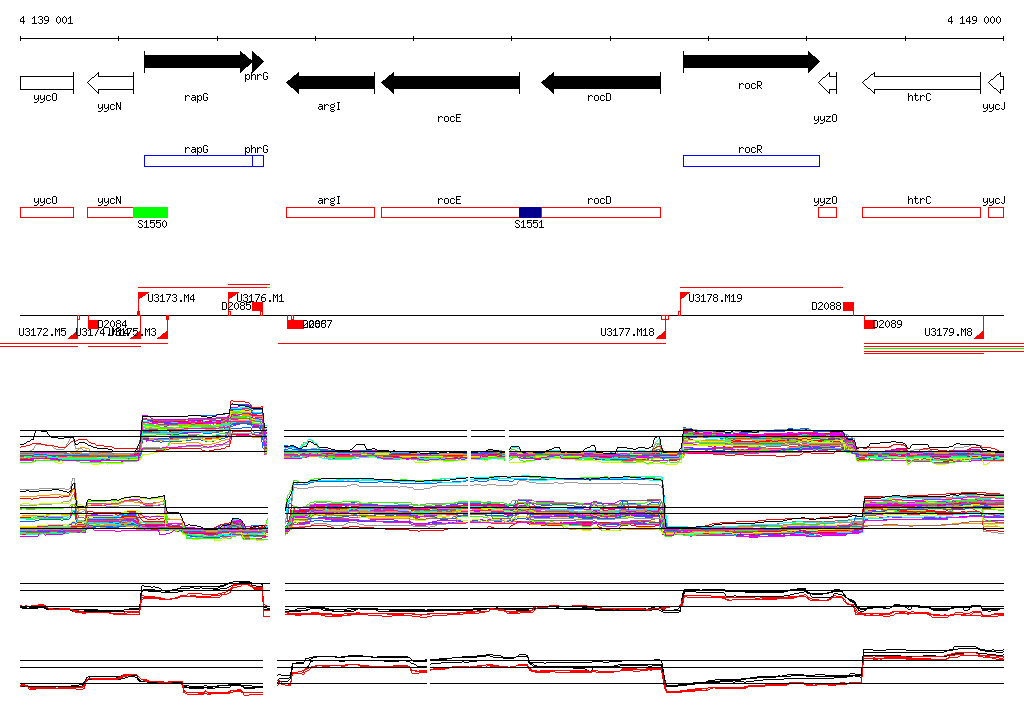
Genomic View of Gene/Segment S1551
Show/Hide
(Legend)
Browse Genome Context