| Start Page |
|
 |
| Start Page |
|
|
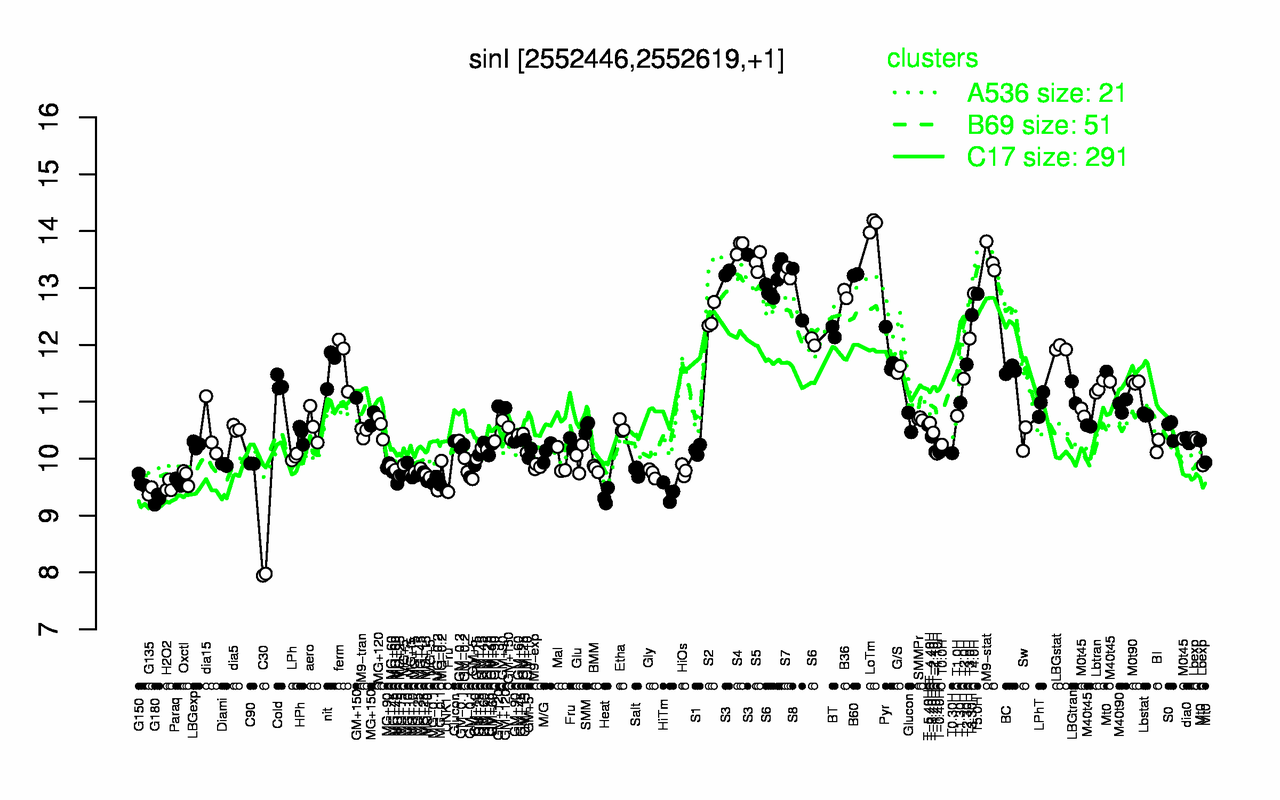
| LoTm | S4 | M9-stat | S5 | S3 | S7 | B60 | T4.0H | T5.0H | B36 |
| 14.1 | 13.7 | 13.5 | 13.5 | 13.4 | 13.3 | 13.2 | 12.9 | 12.9 | 12.9 |
| C30 | G180 | Heat | HiTm | G135 | UNK1 | H2O2 | Paraq | MG-0.1 | G150 |
| 7.96 | 9.29 | 9.34 | 9.42 | 9.43 | 9.44 | 9.51 | 9.59 | 9.6 | 9.61 |