| Start Page |
|
 |
| Start Page |
|
|
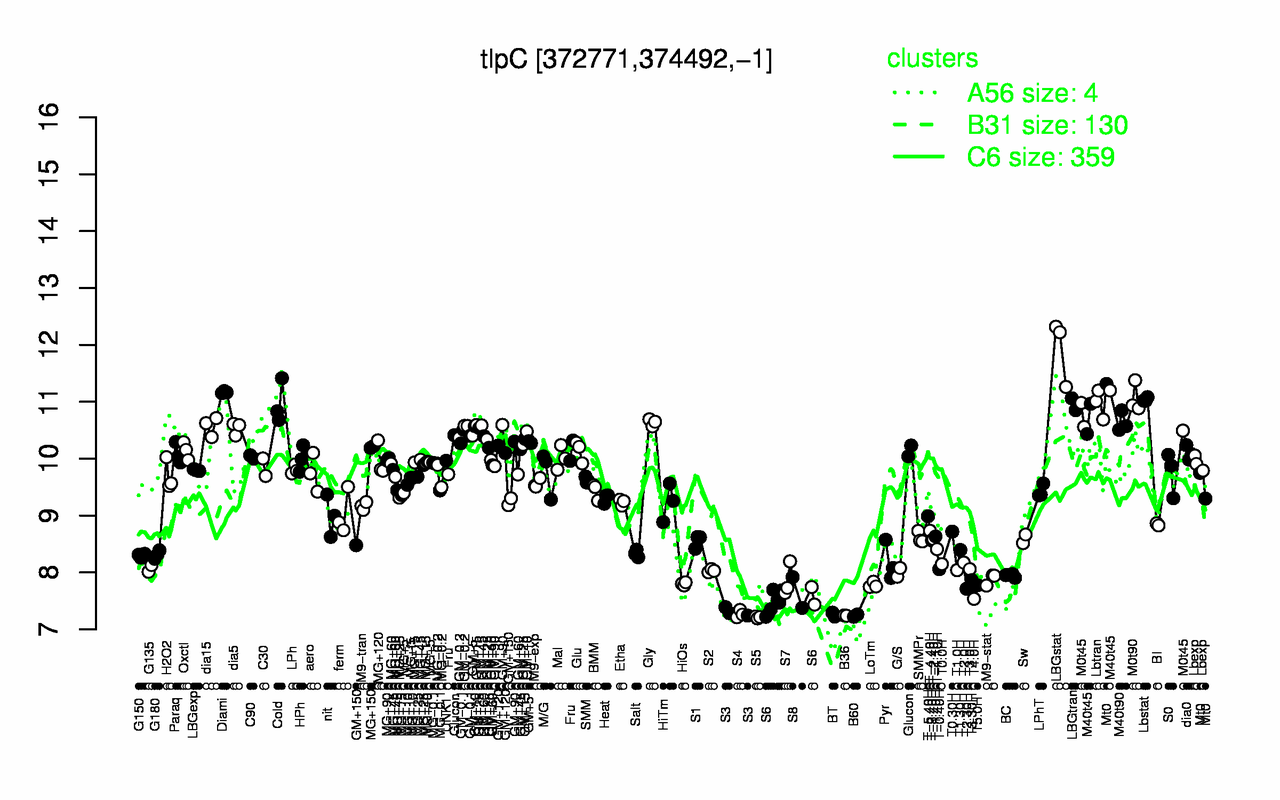
| LBGstat | Diami | M0t90 | Lbstat | Cold | Lbtran | LBGtran | M40t45 | M0t45 | M40t90 |
| 11.9 | 11.2 | 11.1 | 11 | 11 | 11 | 11 | 10.9 | 10.7 | 10.6 |
| S5 | B60 | B36 | BT | S4 | S3 | S6 | T4.0H | S8 | T2.30H |
| 7.21 | 7.24 | 7.24 | 7.26 | 7.27 | 7.31 | 7.49 | 7.54 | 7.65 | 7.71 |