| Start Page |
|
 |
| Start Page |
|
|
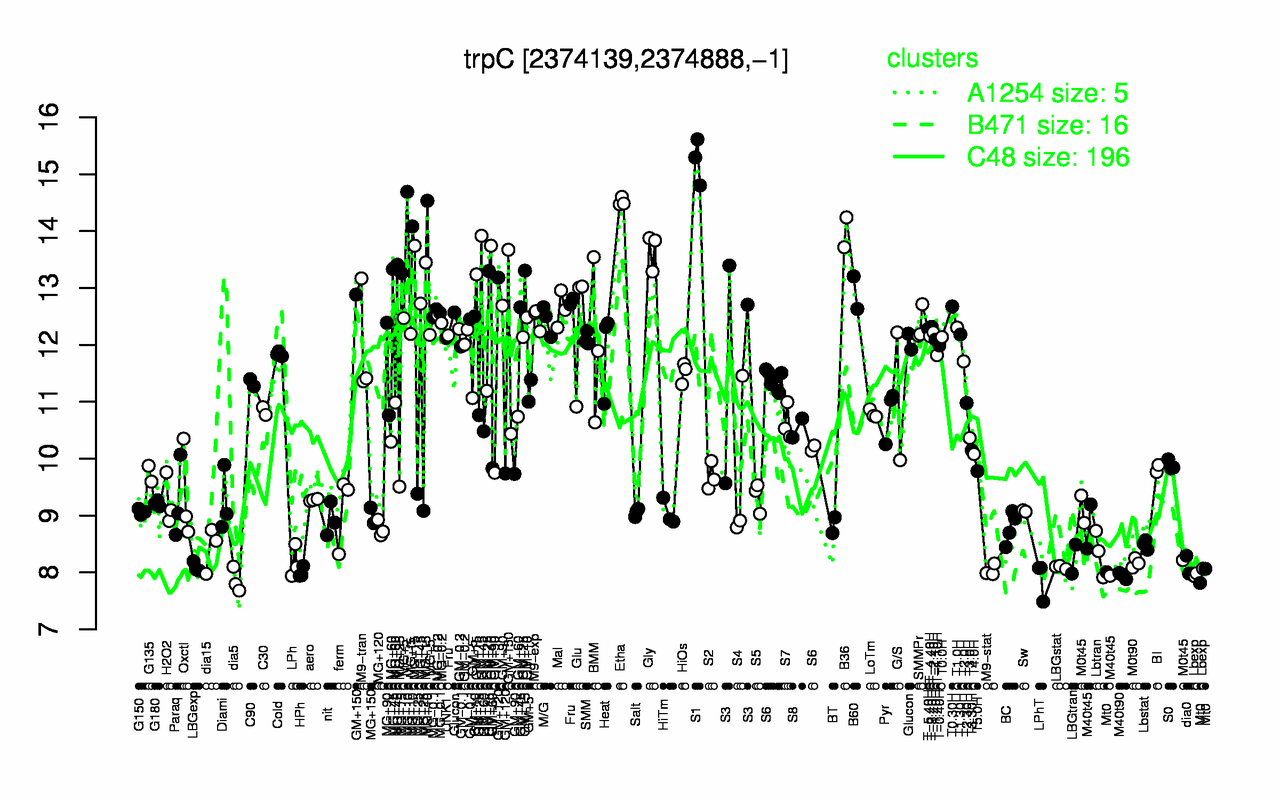
| S1 | Etha | MG+10 | B36 | Gly | MG+15 | GM+45 | GM+15 | MG+45 | B60 |
| 15.2 | 14.5 | 14.4 | 14 | 13.7 | 13.5 | 13.4 | 13.3 | 13.2 | 12.9 |
| dia5 | LPhT | M40t90 | Mt0 | Lbexp | HPh | M9-stat | dia0 | LBGstat | LBGexp |
| 7.86 | 7.88 | 7.95 | 7.96 | 7.99 | 8 | 8.04 | 8.09 | 8.09 | 8.09 |