| Start Page |
|
 |
| Start Page |
|
|
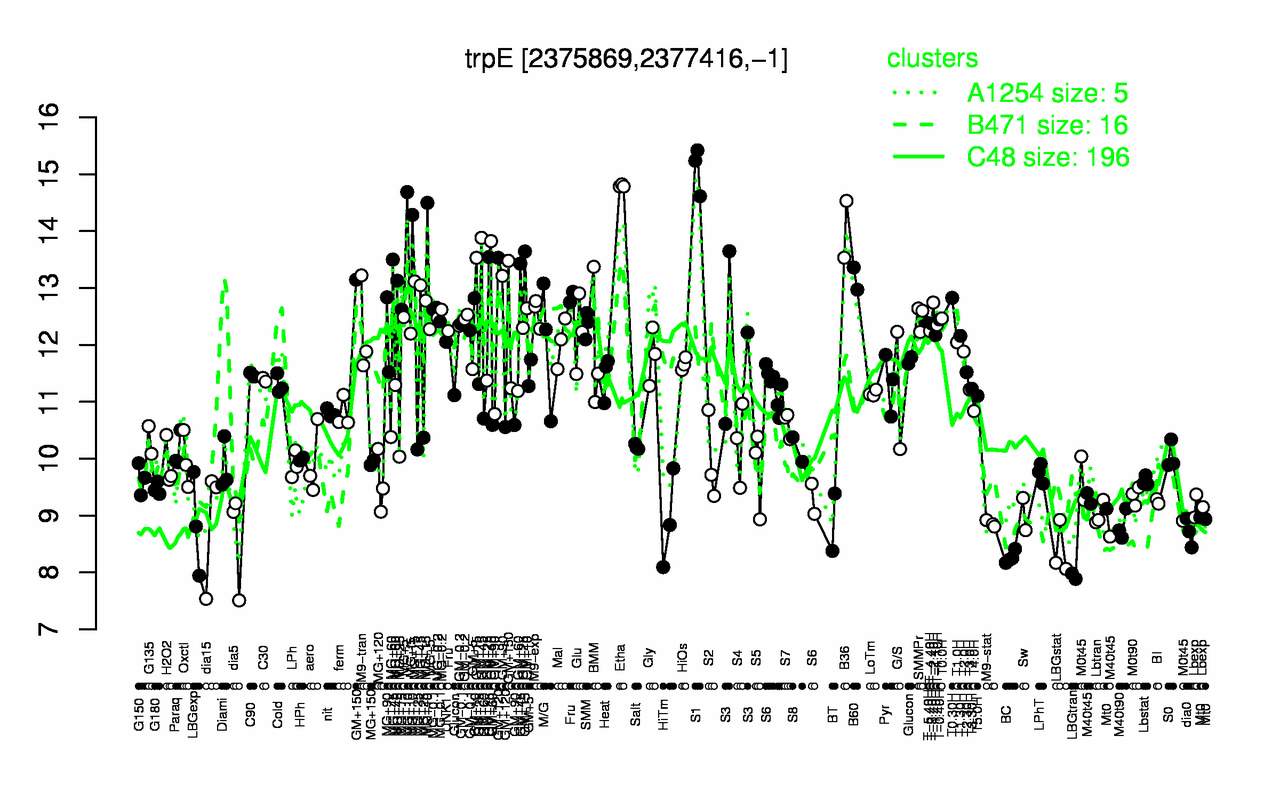
| S1 | Etha | MG+10 | B36 | GM+45 | GM+15 | MG+45 | B60 | MG+15 | T0.30H |
| 15.1 | 14.8 | 14.5 | 14 | 13.7 | 13.6 | 13.2 | 13.2 | 12.8 | 12.8 |
| LBGtran | BC | LBGstat | dia5 | dia0 | M40t90 | LBGexp | M9-stat | dia15 | BT |
| 7.93 | 8.27 | 8.39 | 8.6 | 8.7 | 8.82 | 8.84 | 8.86 | 8.88 | 8.88 |