| Start Page |
|
 |
| Start Page |
|
|
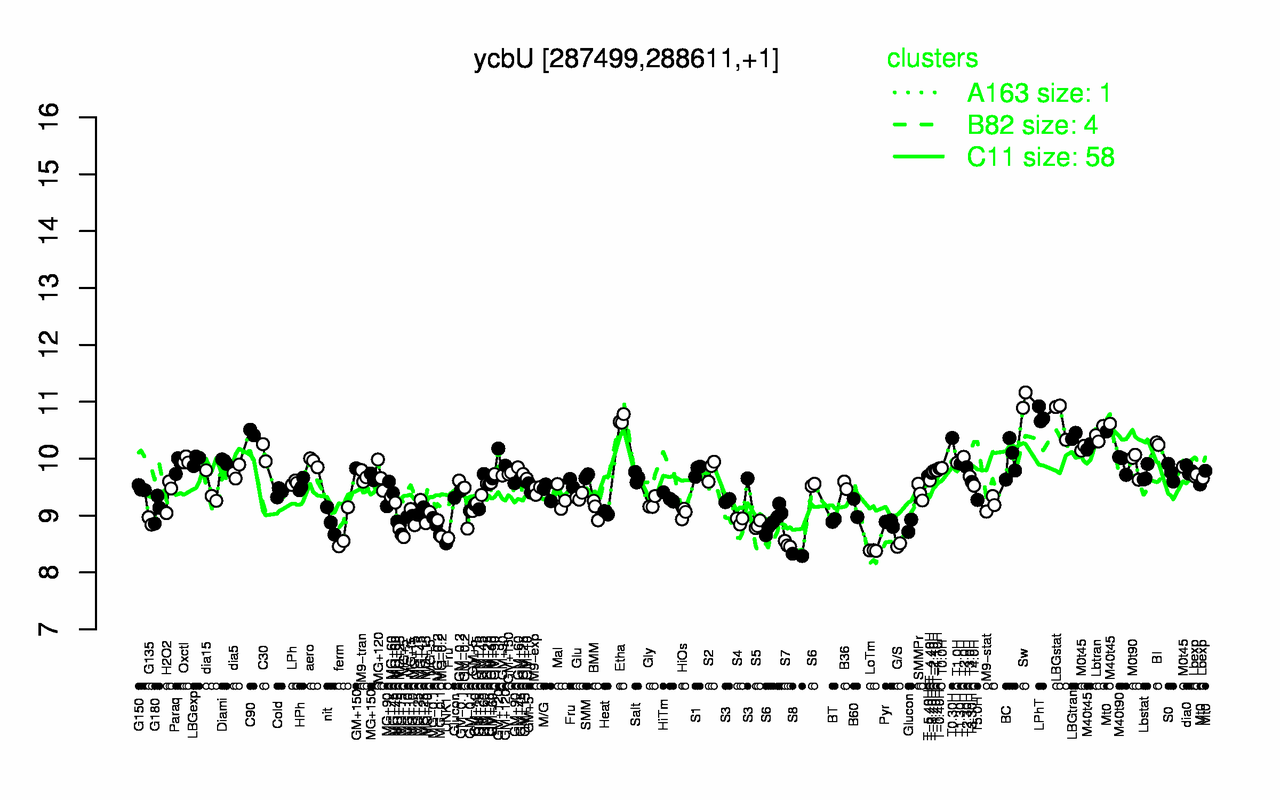
| Sw | LPhT | LBGstat | Etha | C90 | Lbtran | LBGtran | T0.30H | M40t45 | BI |
| 11 | 10.8 | 10.7 | 10.7 | 10.5 | 10.4 | 10.4 | 10.4 | 10.3 | 10.3 |
| S8 | LoTm | G/S | S7 | UNK1 | ferm | MG-0.2 | MG+15 | MG-0.1 | S5 |
| 8.31 | 8.38 | 8.48 | 8.49 | 8.51 | 8.72 | 8.77 | 8.79 | 8.82 | 8.84 |