| Start Page |
|
 |
| Start Page |
|
|
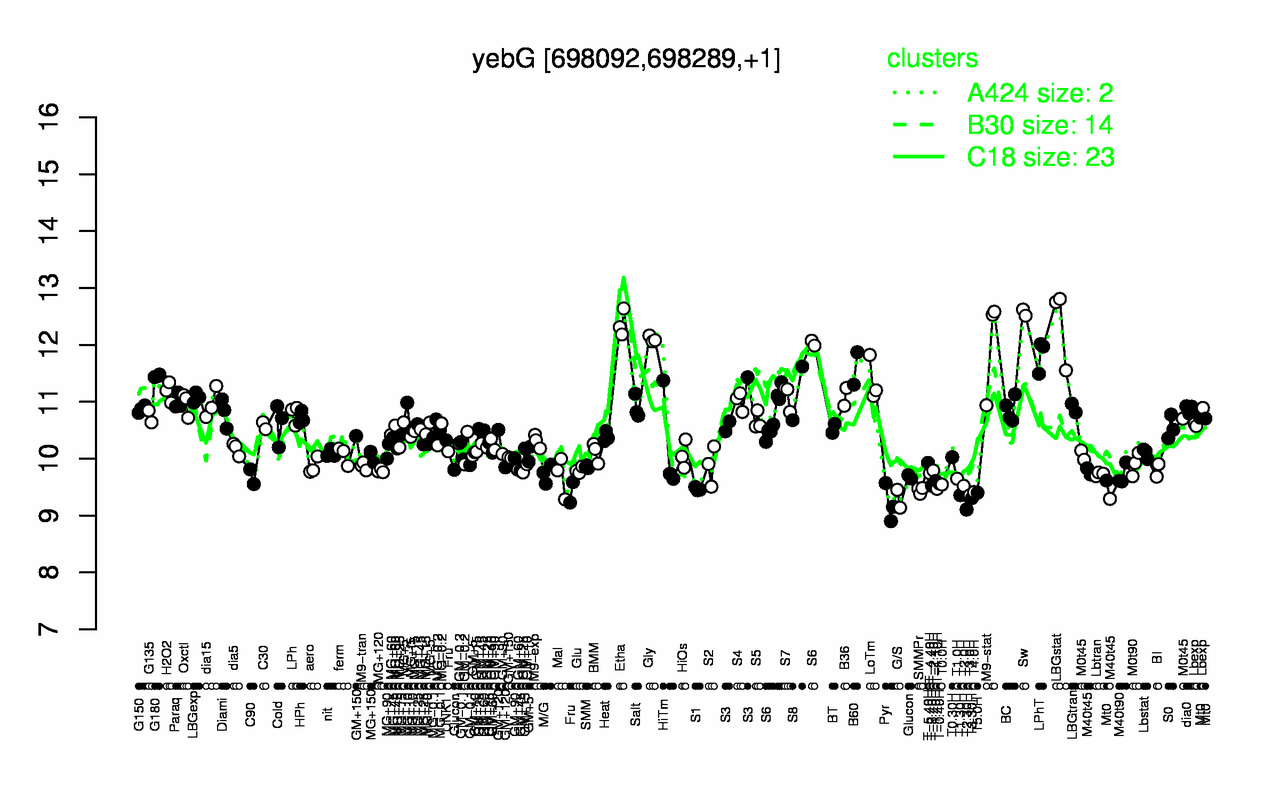
| Sw | Etha | LBGstat | Gly | M9-stat | LPhT | B60 | G180 | LoTm | H2O2 |
| 12.6 | 12.4 | 12.4 | 12.1 | 12 | 11.8 | 11.6 | 11.5 | 11.4 | 11.2 |
| T2.30H | Pyr | G/S | T3.30H | T3.0H | T1.30H | T5.0H | T4.0H | SMMPr | S1 |
| 9.11 | 9.21 | 9.3 | 9.31 | 9.36 | 9.36 | 9.4 | 9.41 | 9.45 | 9.47 |