| Start Page |
|
 |
| Start Page |
|
|
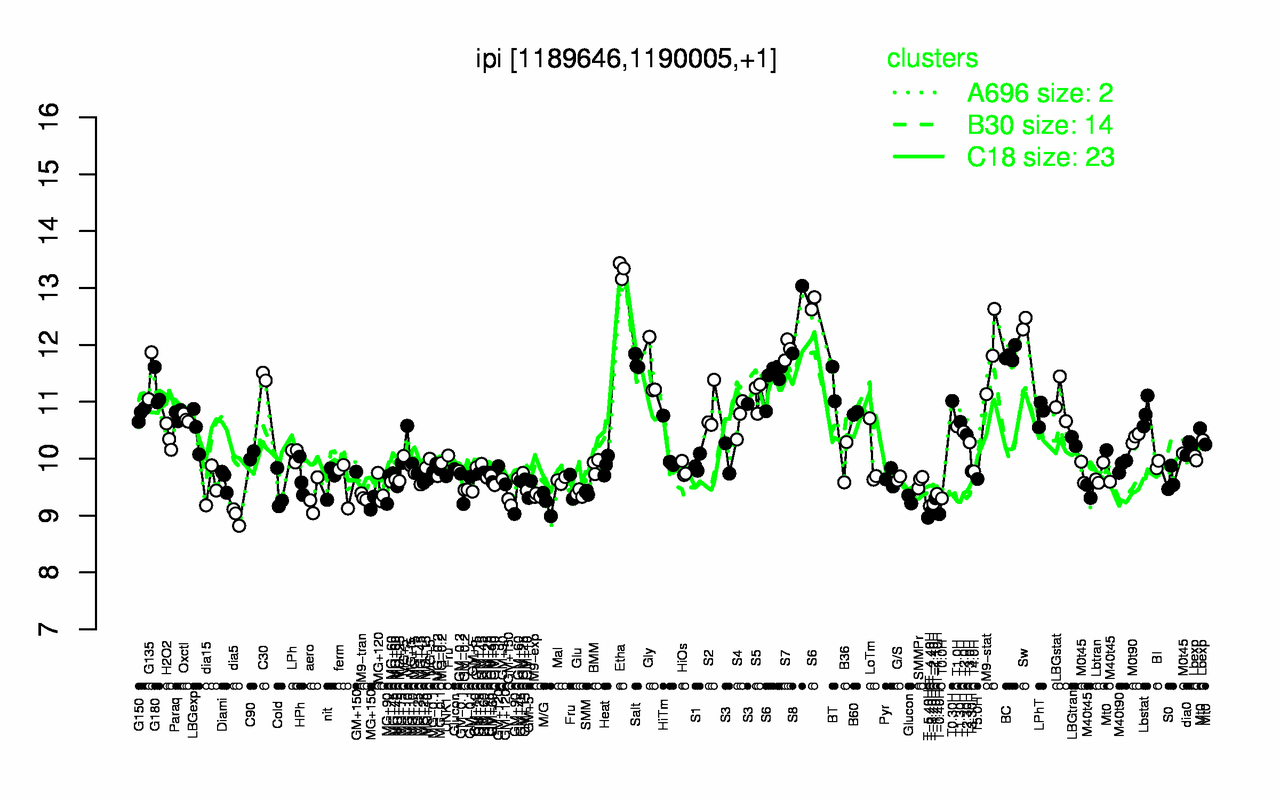
| Etha | S8 | Sw | S7 | M9-stat | BC | S6 | Salt | Gly | G135 |
| 13.3 | 12.4 | 12.4 | 11.9 | 11.9 | 11.8 | 11.7 | 11.7 | 11.5 | 11.5 |
| T-5.40H | dia5 | T-0.40H | T-3.40H | T-4.40H | T-2.40H | M/G | MG+150 | T-1.40H | T0.0H |
| 8.96 | 8.99 | 9.03 | 9.08 | 9.17 | 9.21 | 9.21 | 9.22 | 9.3 | 9.3 |