| Start Page |
|
 |
| Start Page |
|
|
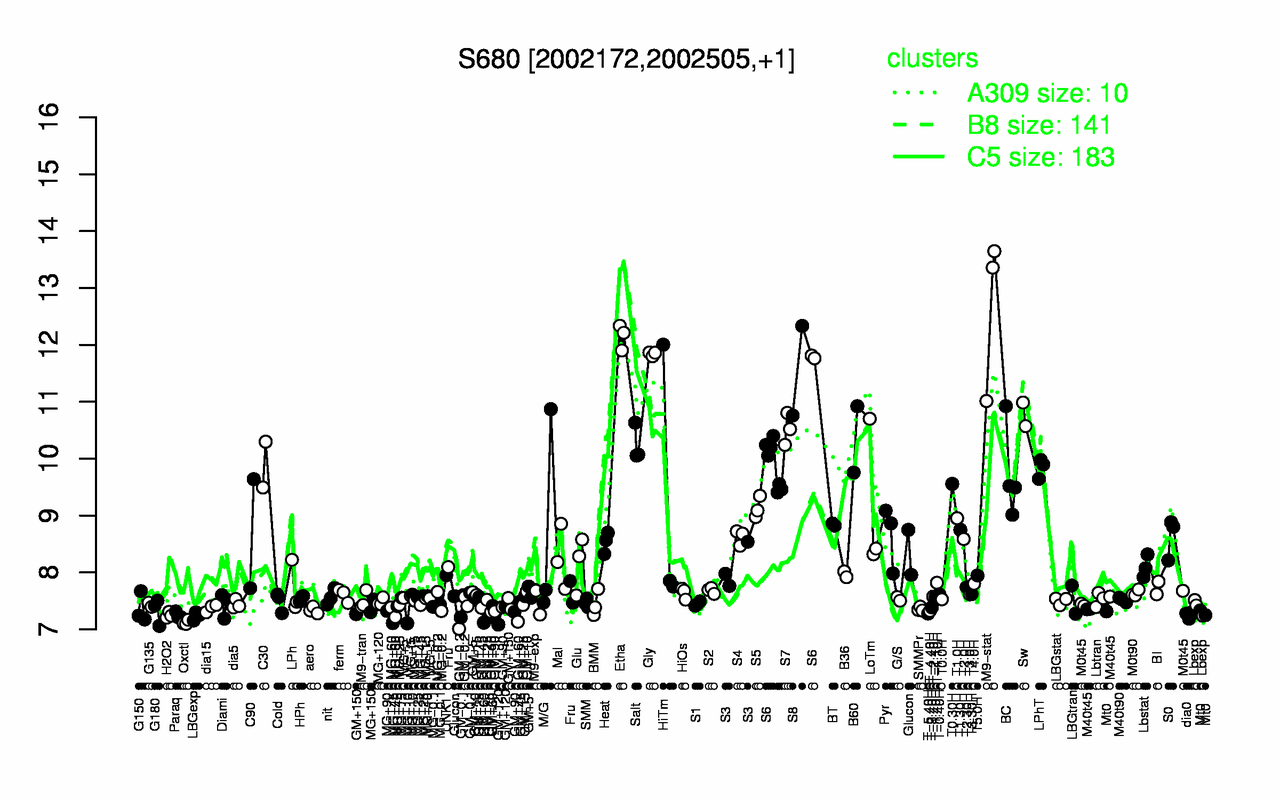
| M9-stat | Etha | Gly | S8 | Sw | S7 | B60 | S6 | Salt | C30 |
| 12.7 | 12.2 | 11.8 | 11.5 | 10.8 | 10.5 | 10.3 | 10.3 | 10.3 | 9.9 |
| Oxctl | GM+60 | LBGexp | GM+120 | Paraq | H2O2 | dia0 | T-5.40H | MG+60 | Mt0 |
| 7.12 | 7.22 | 7.24 | 7.24 | 7.25 | 7.25 | 7.26 | 7.28 | 7.3 | 7.3 |