| Start Page |
|
 |
| Start Page |
|
|
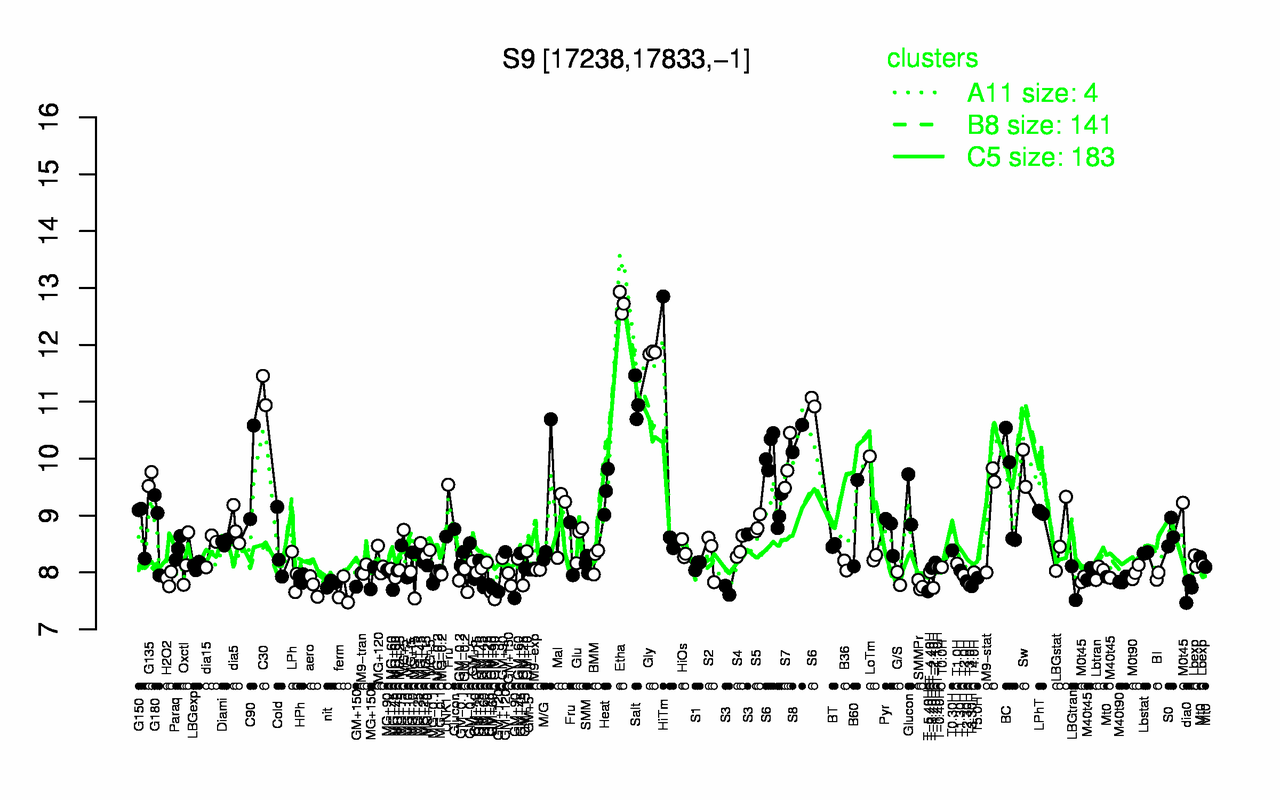
| Etha | Gly | C30 | Salt | S8 | S6 | HiTm | S7 | Sw | C90 |
| 12.7 | 11.9 | 11.2 | 11 | 10.4 | 9.97 | 9.97 | 9.91 | 9.83 | 9.76 |
| ferm | T-5.40H | dia0 | T-2.40H | T3.30H | aero | SMMPr | GM+90 | T3.0H | nit |
| 7.66 | 7.67 | 7.68 | 7.73 | 7.76 | 7.77 | 7.77 | 7.78 | 7.78 | 7.8 |