| Start Page |
|
 |
| Start Page |
|
|
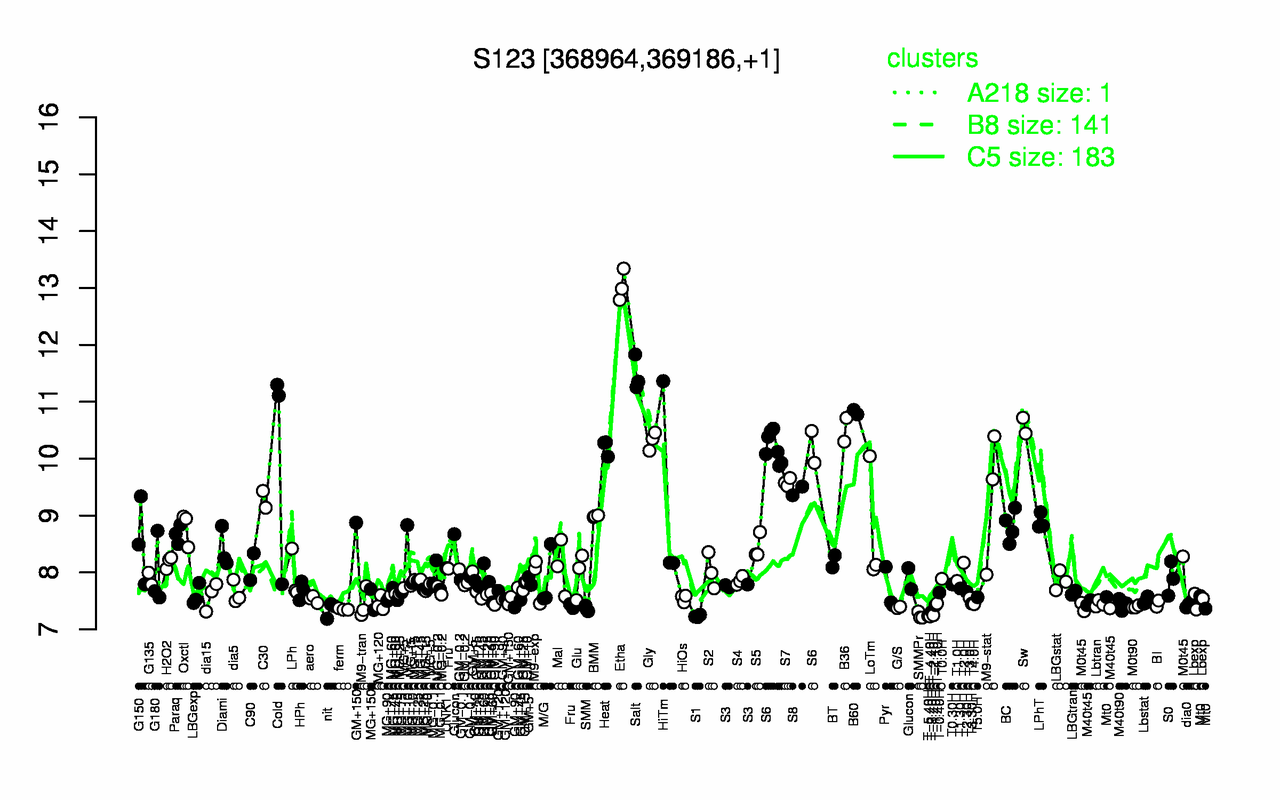
| Etha | Salt | B60 | Sw | B36 | Gly | Heat | S6 | Cold | S7 |
| 13 | 11.5 | 10.8 | 10.6 | 10.5 | 10.3 | 10.2 | 10.2 | 10.1 | 9.58 |
| T-4.40H | S1 | T-5.40H | SMMPr | T-2.40H | T-3.40H | nit | ferm | SMM | G/S |
| 7.23 | 7.23 | 7.24 | 7.24 | 7.25 | 7.31 | 7.35 | 7.35 | 7.36 | 7.39 |