| Start Page |
|
 |
| Start Page |
|
|
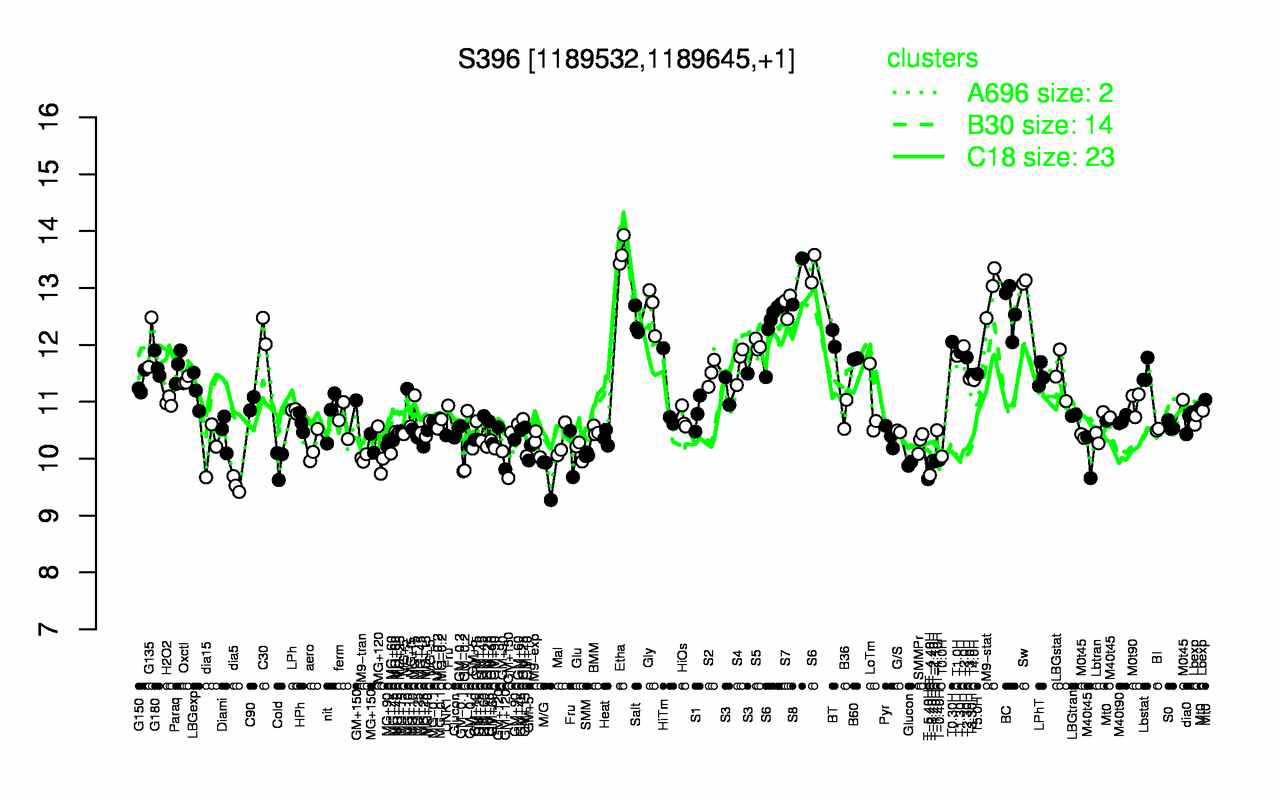
| Etha | S8 | Sw | M9-stat | S7 | BC | Gly | S6 | Salt | C30 |
| 13.6 | 13.1 | 13.1 | 13 | 12.7 | 12.6 | 12.6 | 12.6 | 12.4 | 12.2 |
| dia5 | T-5.40H | T-4.40H | M/G | Cold | T-3.40H | T-1.40H | T-2.40H | T-0.40H | M9-tran |
| 9.55 | 9.64 | 9.71 | 9.71 | 9.93 | 9.94 | 9.95 | 9.96 | 9.98 | 10 |