| Start Page |
|
 |
| Start Page |
|
|
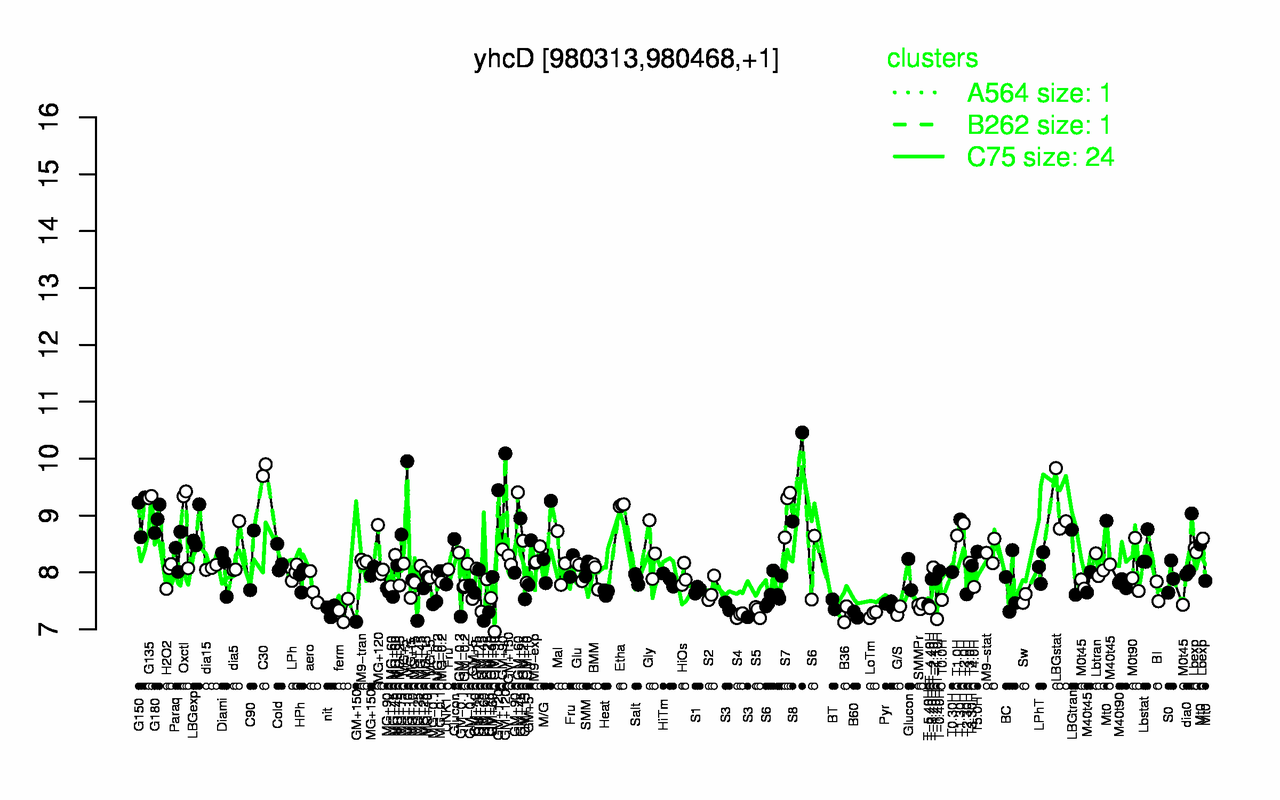
| C30 | GM+120 | S8 | G135 | Etha | LBGstat | S7 | G150 | Oxctl | G180 |
| 9.8 | 9.77 | 9.68 | 9.32 | 9.18 | 9.17 | 9.11 | 9.05 | 8.95 | 8.94 |
| T-1.10H | S4 | B60 | LoTm | B36 | S5 | G/S | ferm | nit | S3 |
| 7.18 | 7.25 | 7.26 | 7.26 | 7.26 | 7.31 | 7.33 | 7.33 | 7.34 | 7.34 |