| Start Page |
|
 |
| Start Page |
|
|
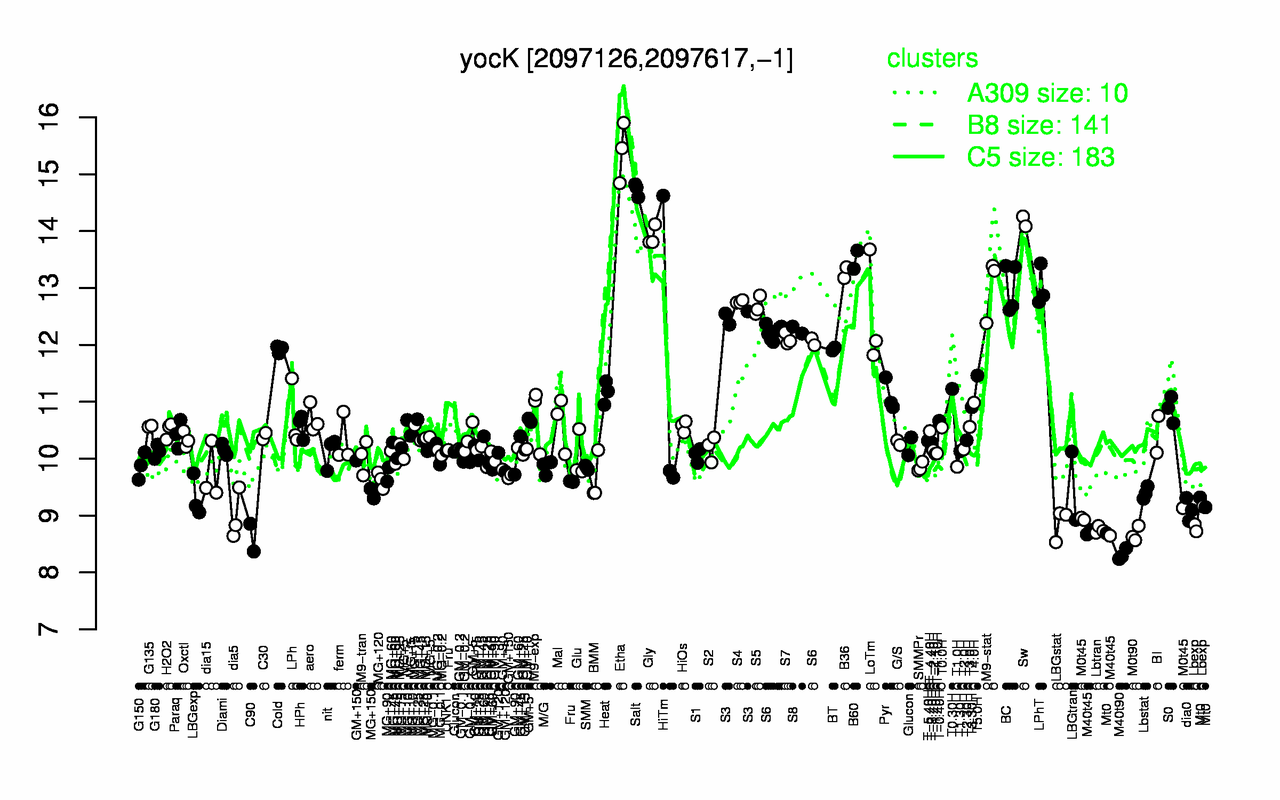
| Etha | Salt | Sw | Gly | B60 | B36 | M9-stat | LPhT | BC | S4 |
| 15.4 | 14.7 | 14.2 | 13.9 | 13.5 | 13.3 | 13 | 13 | 13 | 12.8 |
| M40t90 | C90 | M0t90 | M40t45 | Lbtran | LBGstat | Lbexp | dia5 | M0t45 | Mt0 |
| 8.32 | 8.61 | 8.67 | 8.69 | 8.75 | 8.86 | 8.91 | 8.99 | 9.01 | 9.05 |